[go: up one dir, main page]

We Are The Land and the Land Is Us: Indigenous Women Accompany NASA Campaign Studying Climate Change in the Arctic

University environmental science students Joanne Spearman (left) and Mandy Bayha, from the Northwest Territories in Canada, inside NASA’s Gulfstream III jet during an ABoVE flight. Credits: NASA

My name is Mandy Bayha and I am from a small community called Délįnę [pronounced De-lee-nay] in Canada’s Northwest Territories. With a population of about 500, the community is nestled on the shores of the southwest Keith arm of the beautiful Great Bear Lake. The Sahtúotįnę (which means “people of Great Bear Lake”) have been its only inhabitants since time immemorial. The community is rich in culture and language and has a deep sense of love and connection to the land, especially the lake. I am a student in environmental science and conservation biology and also the indigenous healing coordinator (an initiative called “Sahtúotįnę Nats’eju”) for the Délįnę Got’įnę government. Under the guidance and mentorship of the elders, knowledge holders, and leadership of my community, I have been tasked to facilitate and implement a pilot project that aims to bridge the gap between traditional knowledge and western knowledge to create a seamless and holistic approach to health and wellness.

Traditional knowledge is relevant to everything we do, from healing, governance, and environmental management to early childhood development and education. Traditional knowledge encompasses virtually every human relationship and dynamic and outlines our relationships with each another, our Mother Earth, and our creator. As our elders say, “We are the land and the land is us. The land provides everything to us and is like a mother to us all and we all come from her.” It is our belief that everything is interconnected and in a constant relationship, forever and always.

On August 20 I traveled to Yellowknife to participate in the Arctic-Boreal Vulnerability Experiment, or ABoVE. Currently in its second year, this 10-year project is focused on the vulnerability and resilience of the Arctic and on understanding the effects of climate change on such a delicate ecosystem. ABoVE is important because it can provide a holistic view of climate change in the north by bringing together two knowledge systems: the traditional knowledge of my ancestors and western science. In fact, the project’s first guiding principle is to “recognize the value of traditional knowledge as a systematic way of thinking which will enhance and illuminate our understanding of the Arctic environment and promote a more complete knowledge base.”

I was able to participate in this incredible opportunity with a fellow Délįnę woman named Joanne Speakman, who is also an environmental science student. Our first day started on August 22, bright and early at 8 o’clock in the morning. We met the flight team at the Adlair Aviation hanger to undergo a safety briefing and egress training. It was like walking into a scene from the movie Armageddon. The two ex-U.S. Air Force test pilots were speaking a technical language riddled in codes, and the remote sensing engineers were spouting their checks and balances. I was thrilled to be surrounded by NASA employees all adorned in patches, jumpsuits, and ball caps. Afterward, Dr. Peter Griffith, the project lead, explained everything to Joanne and me in plain language. We then took a tour of the plane and learned how to exit in the unlikely event of an emergency. We were treated so nicely, and I felt more than welcome to participate.

We were invited to sit in a jump seat situated right behind the pilots during take-off and landing. Joanne got take-off and I got landing. What an experience that was! During our four-hour flight, which took us from Yellowknife to Scotty Creek (a permafrost research site near Fort Simpson), Kakisa, Fort Providence, and back to Yellowknife, Dr. Griffith sat with us and explained the ABoVE project. He gave us background on how the “lines”—the strips of areas that were scanned by the radar—were chosen and filled us in on research done in those areas previously, such as major burn sites, permafrost melt, carbon cycling, and methane levels. He referred to pictures while explaining how certain equipment as well as ground data calibration and validation techniques were used.

At work in the Gulfstream jet were flight engineer and navigator Sam Choi from NASA’s Armstrong Flight Research Center and radar operator Tim Miller from NASA’s Jet Propulsion Laboratory. Credits: Joanne Speakman

We also chatted with engineers from NASA’s Jet Propulsion Laboratory in Pasadena, California, who manned the remote sensing station on the flight. They explained that the remote sensing equipment, which was welded to the bottom of the Gulfstream III jet, is made of many tiny sensors that send signals to the ground that bounce back to a receiving antenna on the aircraft. The resulting data tell a story of what is happening on Earth’s surface, revealing features such as inundation (marshy areas where vegetation is saturated with water) and the rocky topography from the great Canadian shield, for example. The sensor they’re using is called an L-band synthetic aperture radar (SAR), which has a long wavelength ideal for penetrating the active layer in the soil. This is important for many reasons but mainly for indicating soil moisture.

Mandy Bayha gets a pilot’s view from the jupm seat as the NASA Gulfstream III comes in for landing, the town of Yellowknife on the shores of Great Slave Lake in view. Credits: Mandy Bayha

When flying above target areas, the pilots had to position the plane precisely on the designated lines to trigger the L-band SAR on the bottom of the plane, which would put the aircraft on autopilot mode and allow the sensor to “fly” the plane for the entire length of scanning the line. Once the scan was complete, the pilots would then take control of the plane again. The precision and accuracy for all those things to work in tandem was extraordinary to witness.

After the last scan, I hopped into the jump seat directly behind the pilots and watched them land the plane. Once on the ground, we were greeted by reporters with Cabin Radio (a local NWT radio station) who interviewed us and took our pictures with the Gulfstream III jet in the background. It was an absolute honor and a once-in-a-lifetime experience that I will never forget.

Fortunately, our incredible journey with NASA wasn’t yet complete. Joanne and I tagged along with two scientists, Paul Siqueira and Bruce Chapman, who are helping to build an Earth-orbiting satellite called the NASA-ISRO Synthetic Aperture Radar, or NISAR. We met up with Paul and Bruce early on the morning of August 24 and identified two lakes located just off the Ingraham Trail, a few kilometers outside of Yellowknife, to collect data that will help in the creation of algorithms to capture and interpret wetland and inundated sites via satellite and remote sensing.  We reached the shores of the first lake and split into two groups, one scientist and one student per group. We walked in separate directions in areas of inundation between the open water and the treeline surrounding the lake and took measurements using an infrared laser for accurate distances between the treeline and open water and made estimations and diagrams to fully detail the ground view.
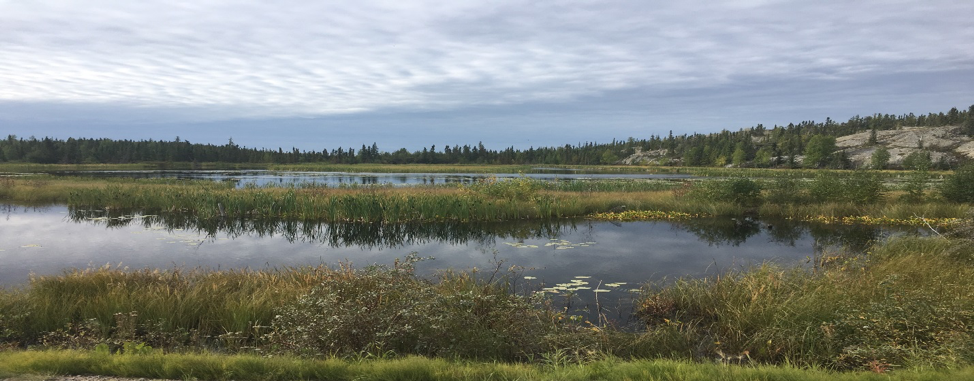
A lake located just off the Ingraham Trail, a few kilometers outside of Yellowknife in Canada’s Northwest Territories, where data was collected that will help in the creation of algorithms to capture and interpret wetland and inundated sites via satellite and remote sensing. Credits: Mandy Bayha
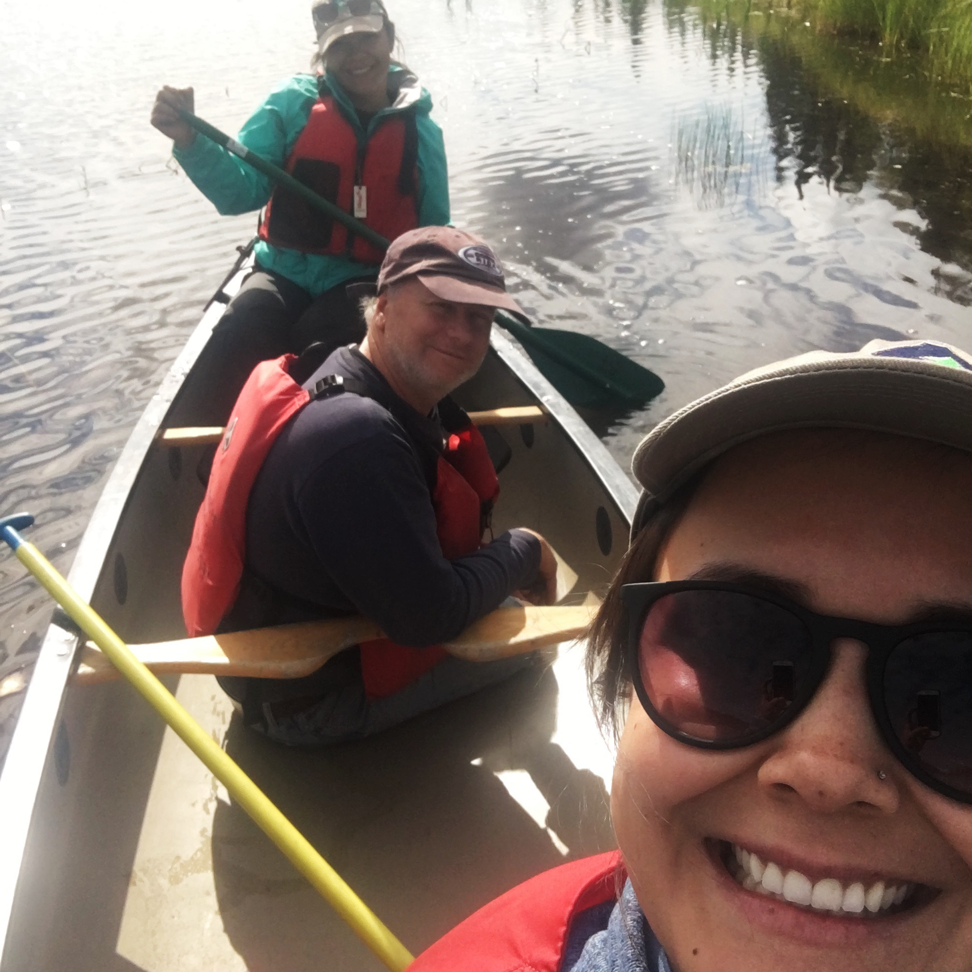
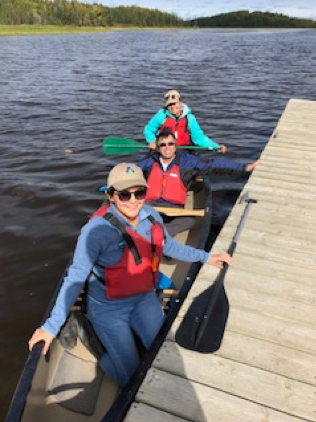
University of Massachusetts Amherst scientist Paul Siqueira enjoyed the last canoe ride of the day with Joanne Speakman and Mandy Bahya. Credits: NASA/Bruce Chapman


We tackled the second lake with a canoe and could not have asked for better weather. We enjoyed our afternoon bathed in the sun. The waterfowl and minnows shared their home with us for a time. During our canoe ride, we learned a lot more about our scientist friends. They were part of a launch that carried some of the first remote sensing technology into space. This technology was then used to study the surface of Venus and Mars. How fortunate were Joanne and I to be able to listen and learn from such a brilliant crew of scientists who have had amazing careers.

It was an enriching and humbling experience to participate in the ABoVE project. If an organization such as NASA realizes that indigenous traditional knowledge is both valid and important, then I am hopeful for our next generation of indigenous people. I believe that this is the first step in reconciliation: acknowledgment and appreciation. I would be honoured to participate again; however, I am more than grateful to know that there is this collaboration happening and that it includes the indigenous Dene of the north.

Mahsi Cho (thank you)!

Chasing Sea Ice While Playing Tag With a Satellite

New sea ice growing in a lead at different stages of formation with the pink skies creating nice lighting on the ice. Credits: NASA/Linette Boisvert


by Linette Boisvert / PUNTA ARENAS, CHILE /

This mission, called Mid-Weddell, is probably the most complex of not only the fall 2018 Antarctic campaign but all of IceBridge.

Overnight I got to take part in a truly historic Operation IceBridge (OIB) mission and I couldn’t be more happy or excited to tell you all about it! This mission, called Mid-Weddell, was probably the most complex of not only the fall 2018 Antarctic campaign but all of IceBridge. To add to this, some unforeseen issues made this particular mission difficult. Upon landing after our previous mission, we were informed that there was a local fuel trucker strike. This meant NO FUEL for all of Punta Arenas, Chile. So we had no fuel for our plane, which meant we couldn’t fly the next day and had no clue when this strike would be resolved.

The strike was resolved after a few days, but the Mid-Weddell mission was again delayed when we found out that there were cracks in the NASA DC-8 pilot’s window. A new one had to be sent from Palmdale, California, and installed before we could fly again.

Local Chilean fuel truckers burning tires along the side of the road in protest. Credits: NASA/Jeremy Harbeck


NASA’s DC-8 Crew replacing the pilot’s window. Credits: Kyle Krabill

After all of these added stressors, we began to worry that we wouldn’t even be able to pull off this mission because it was an overnight flight and had to be timed perfectly with an ICESat-2 satellite overpass. These two mandatory factors are not so easy to achieve based on: 1) The weather in the Weddell Sea has to be clear, as in no low or high clouds, so that ICESat-2 can see the sea ice that we are flying over; 2) there has to be a crossover of ICESat-2 in the middle of the night and in the middle of the Weddell Sea.

Map of the Mid-Weddell sea ice mission. Credits: NASA/John Sonntag

In order to make things easier on ourselves (please note my sarcasm here), we were also “chasing the sea ice” during this flight. Why do we need to chase the sea ice, one might ask? Because sea ice, frozen floating sea water, is constantly in motion, being forced around by winds and ocean currents. This makes it rather difficult to fly over the same sea ice as ICESat-2  because the satellite can fly over our entire science flight line in about 9 seconds, where as it takes us multiple hours to do so by plane.  Thus, in order to fly over the same sea ice, the sea ice must be chased during flight.

A view of NASA’s DC-8 engines and wing as we were chasing the sea ice below. Credits: NASA/Linette Boisvert

Chasing the sea ice is essentially my OIB baby project, and before this campaign I diligently worked on writing code that would take in our latitudes and longitudes along our flight path, and, depending on the wind speed, wind direction, and our altitude from the plane, determine where the sea ice that ICESat-2 flew over would have drifted by the time our plane got there. This way we could essentially fly over the same sea ice that the satellite flew over. To do this we asked the pilots to take the plane down to 500 feet (yes, 500 FEET!!) above the surface and stay there for roughly a minute in order to take wind measurements. I then plugged these values into my code program and changed our flight path so that we could fly over the same sea ice. We monitored the winds during flight, and if they changed significantly we would do this maneuver again. Now how cool is that? I was in charge of changing our flight path as we flew! Can’t say I’d ever “flown” a plane before.

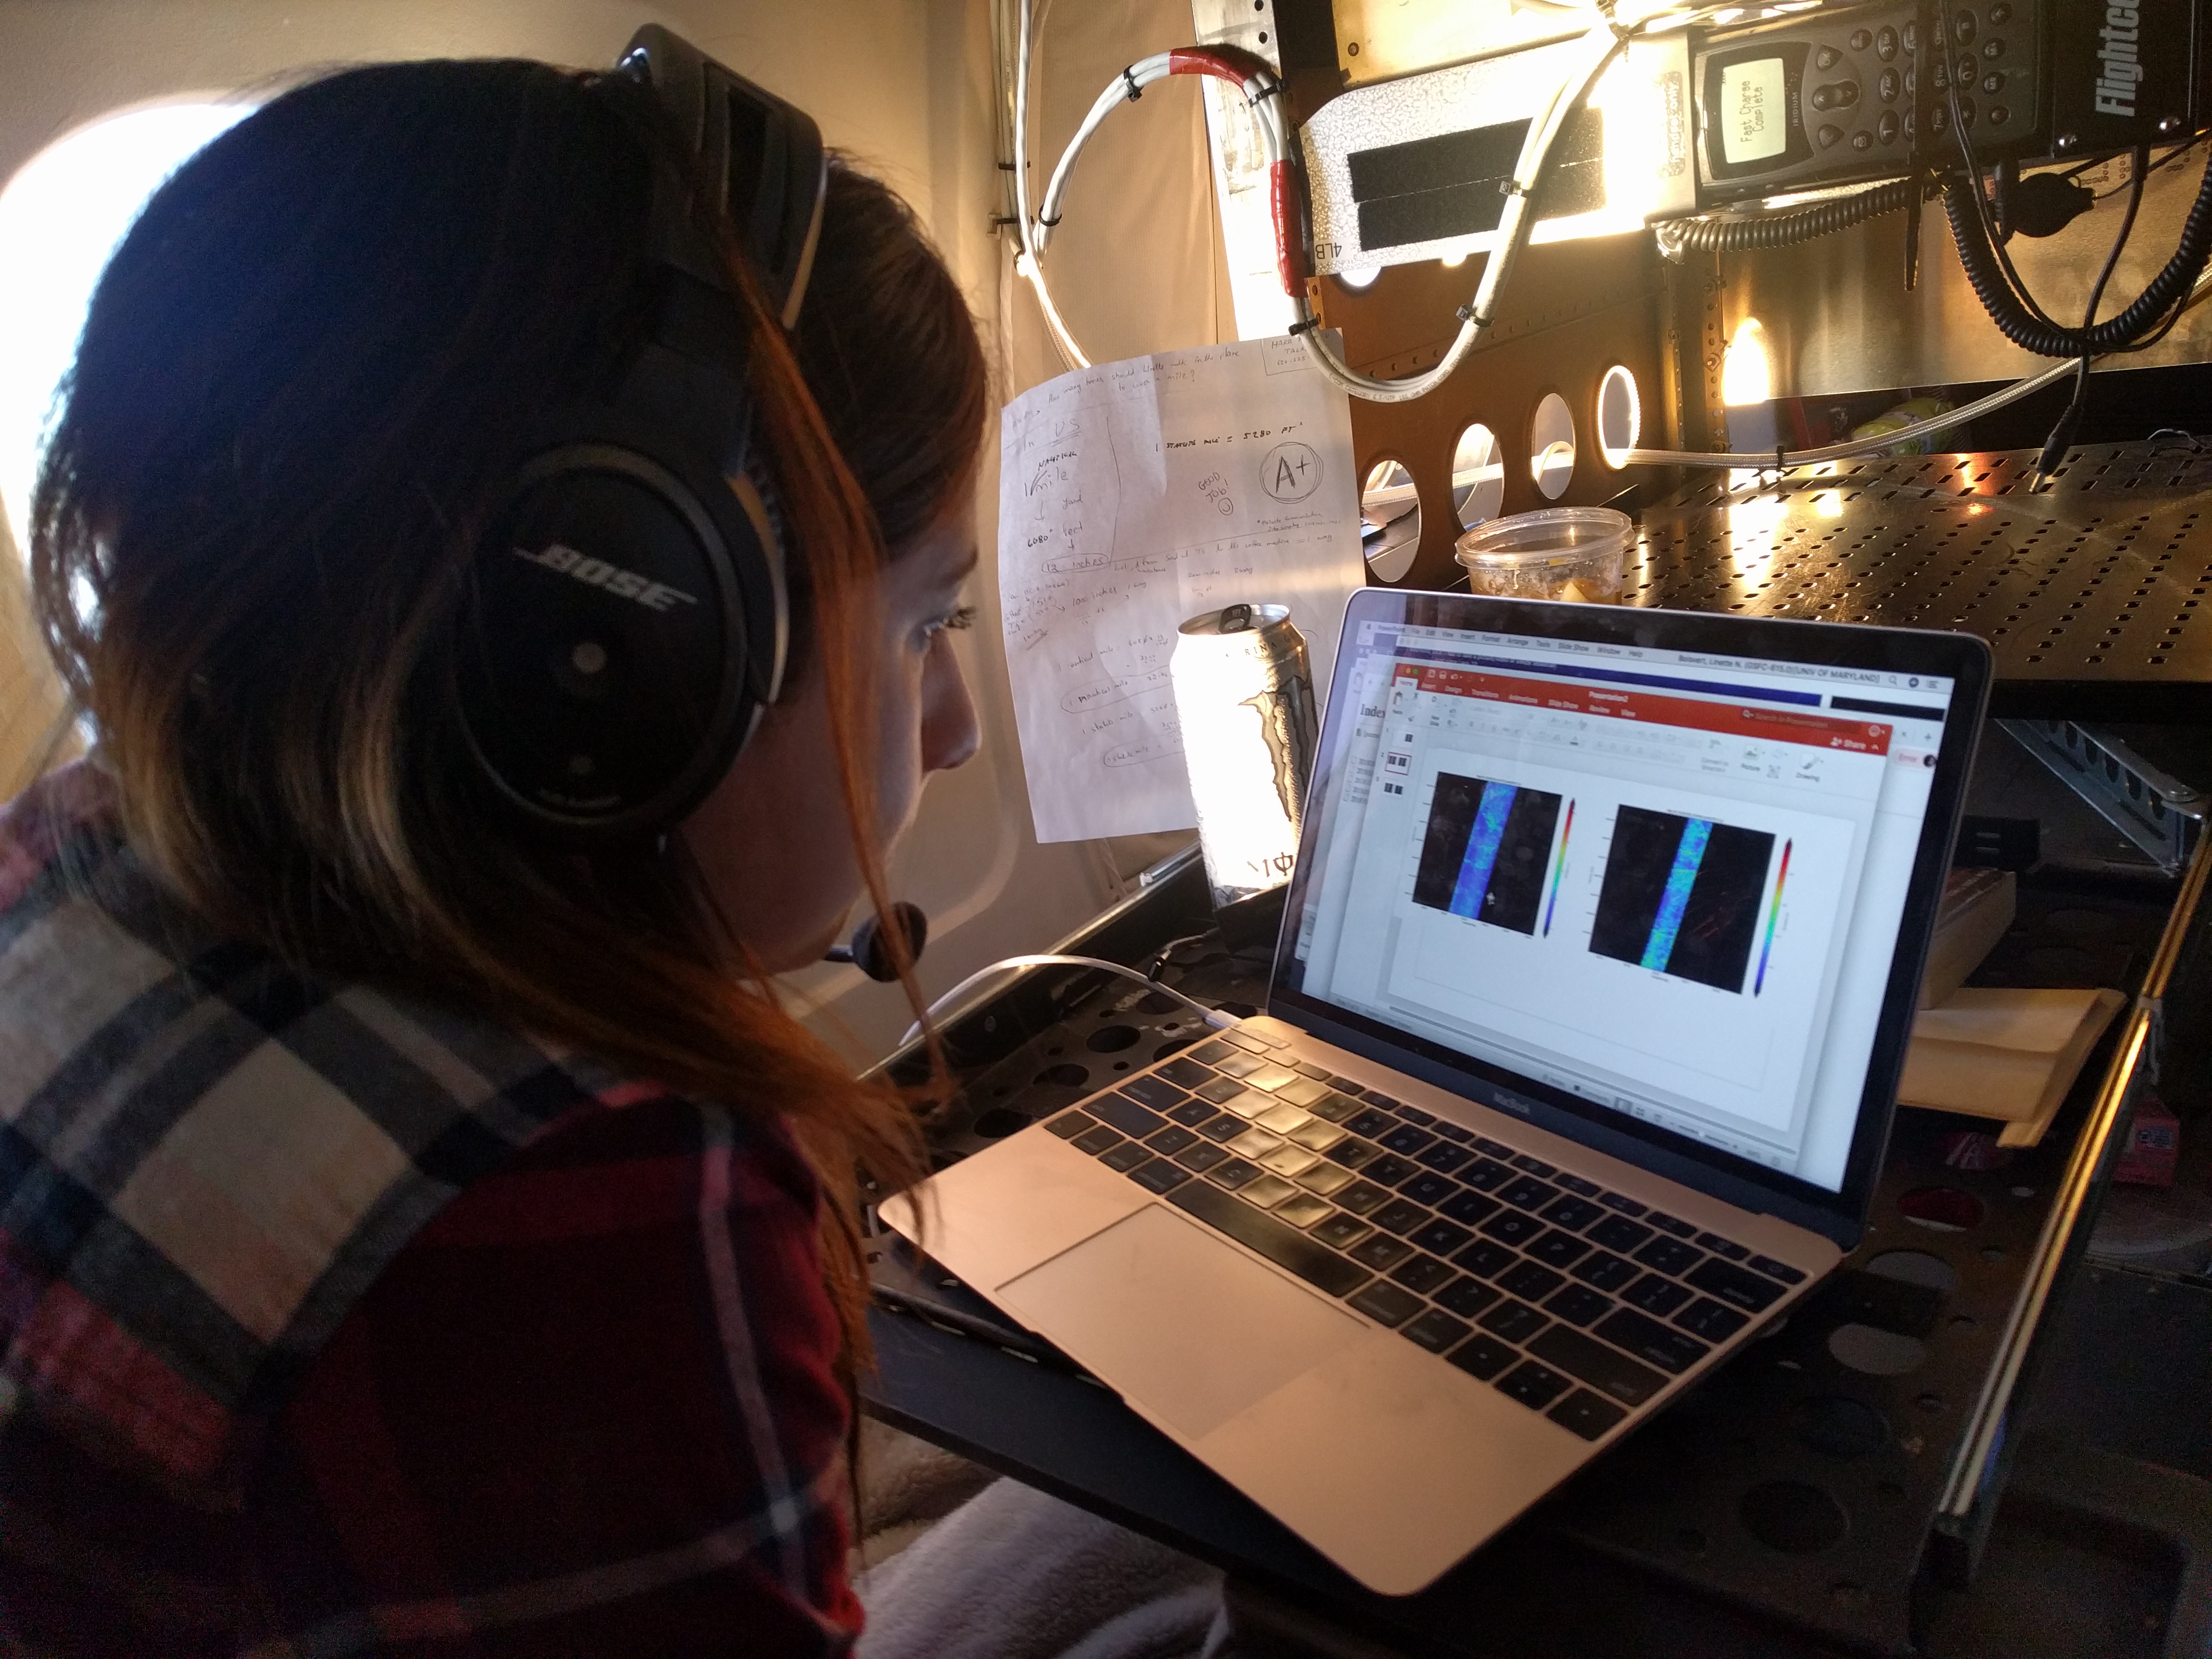
Lynette Boisvert, Operation IceBridge’s deputy project scientist, is “chasing the sea ice” during the science mission. Credits: NASA/Hara Talasila


During our flight and because of our flight path we were able to see multiple sunsets and sunrises as the sun bobbed up and down across the horizon.

Since our flight was a low-light flight it had to be conducted at night, so we took off from Punta Arenas at 7pm for an 11-hour flight, heading south to the Weddell Sea. During our flight and because of our flight path we were able to see multiple sunsets and sunrises as the sun bobbed up and down across the horizon. Because of the low lighting, the sky changed from oranges to pinks to blues, making for quite the show from the DC-8’s windows. Even the land ice lovers enjoyed it.

Sunrise over the Weddell Sea and sea ice below from the window of the DC-8 Credits: NASA/Linette Boisvert

Right before 1:35am local time, John Sonntag began a 10-second countdown, and when zero was reached, ICESat-2 crossed directly above our plane, thus “playing tag with the satellite” and making history, as it was the first time this was done since the satellite’s launch a little over a month ago. We all began chatting on our headsets about how awesome it was to be part of this mission and to be able to witness this moment. This is what OIB had been working toward since its beginning in 2009. The data gap was now successfully bridged between ICESat and ICESat-2.

An ICESat-2 flyover as seen from Punta Arenas, Chile, in the middle of the night. Credits: NASA/Jeremy Harbeck

Later, during the flight, I began to think about how everyone on the team really stepped up and how easily we were all able to work together to make this mission happen. I mean, we literally chased sea ice and played tag with a satellite during this flight! It took the pilots’ maneuvering, the aircraft crew’s hard work, the instrument teams’ and scientists’ steady collecting of data—everyone working together all night long—for this mission to run smoothly. I am truly grateful for everyone’s hard work and dedication and was so happy to be there that night. As we on OIB say, “Team work makes the dream work.”

IceBridge Deputy Project Scientist Linette Boisvert is interviewed, explaining how the crew chases sea ice in flight. Credits: NASA/Hara Talasila)

Chasing Clouds and Smoke Over the Southeast Atlantic

By Michael Diamond / SÃO TOMÉ AND PRÍNCIPE /

Michael is a PhD student at the University of Washington in Seattle.

Image 1: Michael Diamond in front of the P-3 at São Tomé International Airport before the October 10th, 2018, ORACLES flight. Photo credit: Rob Wood
Michael Diamond in front of the P-3 at São Tomé International Airport before the October 10th, 2018, ORACLES flight. Photo credit: Rob Wood

Our October 2018 deployment may be our last of the ORACLES (ObseRvations of Aerosols above CLouds and their intEractionS) campaign, but it certainly won’t be our least. (We love each of our three deployments equally, of course.) During ORACLES, scientists from multiple NASA centers, universities, and other partners came together to study the complex interactions between smoke from fires on the African continent and low-lying clouds, called stratocumulus, over the Atlantic Ocean between September 2016 and October 2018.

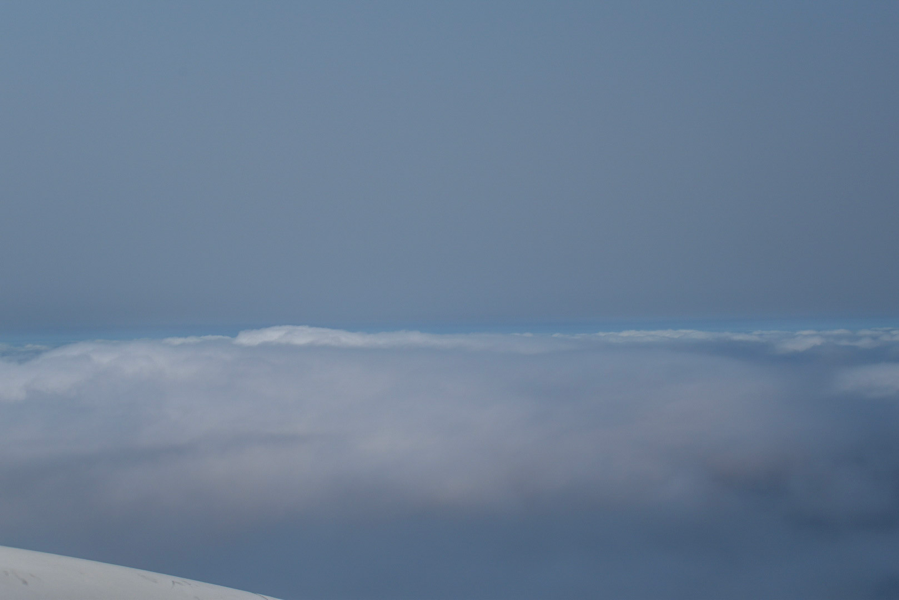
Image 2: View of smoke produced by fires in southern Africa over low-lying clouds in the southeast Atlantic Ocean from onboard the P-3 during the October 10th, 2018, ORACLES flight. Photo credit: Michael Diamond
View of smoke produced by fires in southern Africa over low-lying clouds in the southeast Atlantic Ocean from onboard the P-3 during the October 10th, 2018, ORACLES flight. Photo credit: Michael Diamond

As my colleague Andrew wrote previously, climate models struggle to accurately capture the physical processes that occur when smoke particles, also known as aerosols, overlie and mix into clouds, in part because these processes occur at such small scales. The effects of aerosol-cloud interactions can include warming from sunlight being absorbed by the smoke and/or cooling from changes in the clouds’ brightness, coverage, and precipitation — it is still uncertain whether the heating or cooling effects cancel each other out or if one effect wins out in the end. We need the best observations we can get to better understand the fundamental physics and chemistry of this smoke-cloud system and use that knowledge to improve the models. Because the clouds and smoke we’re interested in are many miles away from land, the best way to study them is from the air.

Enter the NASA P-3 Orion: a four-engine turboprop plane that can directly sample the smoke plume and the clouds, from 20,000 feet in the air all the way down to just above the ocean surface.

Image 3: Michael Diamond (front) operating a Counterflow Virtual Impactor Inlet System (CVI), which lets instruments make aerosol measurements within the clouds, and Steve Broccardo (back) operating the 4STAR (Spectrometers for Sky-Scanning, Sun-Tracking Atmospheric Research) instrument, a sunphotometer that can measure smoke properties at multiple wavelengths of light, aboard the P-3 on the October 10th, 2018, ORACLES flight. Photo credit: Andrew Dzambo
Michael Diamond (front) operating a Counterflow Virtual Impactor Inlet System (CVI), which lets instruments make aerosol measurements within the clouds, and Steve Broccardo (back) operating the 4STAR (Spectrometers for Sky-Scanning, Sun-Tracking Atmospheric Research) instrument, a sunphotometer that can measure smoke properties at multiple wavelengths of light, aboard the P-3 on the October 10th, 2018, ORACLES flight. Photo credit: Andrew Dzambo

Initial results from our September 2016 deployment showed that, because it takes a fairly long time for the smoke from above to mix down into the cloudy layer, it may be best to study the smoke-cloud interactions by following individual cloud systems. This means we can account for how a cloud changes and evolves over time and how long the clouds and smoke have been in contact. For two of our ORACLES-2018 flights, we attempted to do just this, using a forecast model from the National Oceanographic and Atmospheric Administration (NOAA) to predict where clouds sampled on one flight would end up the next day, and then sampling the clouds there. For a fairly typical wind speed of around 10 knots, the clouds can travel approximately 300 miles in one day.

A great opportunity for this type of flight arose on October 2nd. The day before, a “pocket of open cells,” or POC, developed around the area we normally fly. In a POC, the stratocumulus clouds arrange themselves in a quasi-hexagonal pattern, with cloudy areas on the edges and clear skies in between. In “closed cell” clouds, which we sampled more regularly, the opposite pattern holds, with clear slots at the sides and overcast skies in between. During most ORACLES flights, we aimed to sample “polluted” clouds, with lots of aerosols in the air below the cloud. POCs are an interesting case because they tend to be very “clean,” removing aerosols from the air through drizzle. This precipitation is very likely the driving factor determining whether the clouds arrange themselves in open or closed cellular formations. We still have open questions remaining about whether aerosols can suppress precipitation and induce the open cells to transition into closed cells.

Image 4: True color image of the POC on October 1st from NASA’s Moderate Resolution Imaging Spectroradiometer (MODIS) instrument. The dotted black line shows the trajectory of a point (white circle) originally inside the POC for three days as it travels around the southeast Atlantic. The POC can be seen as the anvil-shaped collection of open cell hexagonal clouds between 8 and 12 degrees south and 0 and 8 degrees east. Image credit: Michael Diamond/NASA Worldview/NOAA Air Resources Laboratory (ARL)
True color satellite image of the POC on October 1st from NASA’s Moderate Resolution Imaging Spectroradiometer (MODIS) instrument. The dotted black line shows the trajectory of a point (white circle) originally inside the POC for three days as it travels around the southeast Atlantic. The POC can be seen as the anvil-shaped collection of open cell hexagonal clouds between 8 and 12 degrees south and 0 and 8 degrees east. Image credit: Michael Diamond/NASA Worldview/NOAA Air Resources Laboratory (ARL)

We first sampled the POC on October 2nd, flying above, below, and within the clouds. We were also able to sample another interesting feature: the white diagonal line of cloud that can be seen cutting through the POC near where we flew is called a ship track. Ship tracks are formed where the exhaust from ships emits particles and gases that form new aerosols, which can then interact with the clouds. (There are some other ship tracks visible in the satellite imagery from October 1st and October 2nd as well.) As expected, most clouds we sampled were drizzling and the below-cloud air was very clean. The more overcast linear feature in the ship track will help us better understand how clouds transition between open and closed cells.

Image 5: True color image of the POC on October 2nd from MODIS. The dotted black line shows the trajectory from before. The white circle is now at the location the original air was forecasted to have traveled to one day later. The POC can be seen as the anvil-shaped collection of open hexagonal clouds between 6 and 10 degrees south and 2 and 10 degrees east. Image credit: Michael Diamond/NASA Worldview/NOAA ARL
True color satellite image of the POC on October 2nd from MODIS. The dotted black line shows the trajectory from before. The white circle is now at the location the original air was forecasted to have traveled to one day later. The POC can be seen as the anvil-shaped collection of open hexagonal clouds between 6 and 10 degrees south and 2 and 10 degrees east. Image credit: Michael Diamond/NASA Worldview/NOAA ARL

On October 3rd, we set out on a mission to resample the POC and see how the clouds had changed and whether any smoke had been mixed into the below-cloud layer. We were heartened to see from our satellite imagery that the POC had traveled to roughly the same area we had forecasted. The POC by this time was dissipating: some well-developed open cells are still visible, but the POC boundaries had eroded and more “actinoform,” or lace-like, clouds had formed.

Image 6: True color image of the dissipating POC on October 3rd from MODIS. The dotted black line shows the trajectory from before. The white circle is now at the location the original air was forecasted to have traveled to two days later. The POC can be seen as the collection of open cells and actinoform clouds between 6 and 9 degrees south and 3 and 9 degrees east.)
True color satellite image of the dissipating POC on October 3rd from MODIS. The dotted black line shows the trajectory from before. The white circle is now at the location the original air was forecasted to have traveled to two days later. The POC can be seen as the collection of open cells and actinoform clouds between 6 and 9 degrees south and 3 and 9 degrees east.

More analysis will need to be done after we’ve had a chance to calibrate and quality control the data, but our initial readings suggested the below-cloud layer was still relatively clean, with some mixing of smoke from above evident.

At the end of this October 2018 deployment, data collection for the ORACLES campaign will be complete, but there will be plenty of science left to do. Not only do we have our own data to analyze, but there have been other American, British, French, German, and Namibian and South African teams studying similar questions in the same region that we will collaborate with. Together, the multiple field campaigns and model intercomparison projects just completed and currently in the works will greatly improve our understanding of smoke-cloud interactions over the southeast Atlantic and their implications for the regional and even global climate system.

Inspiring Students 1,500 Feet Above Antarctica

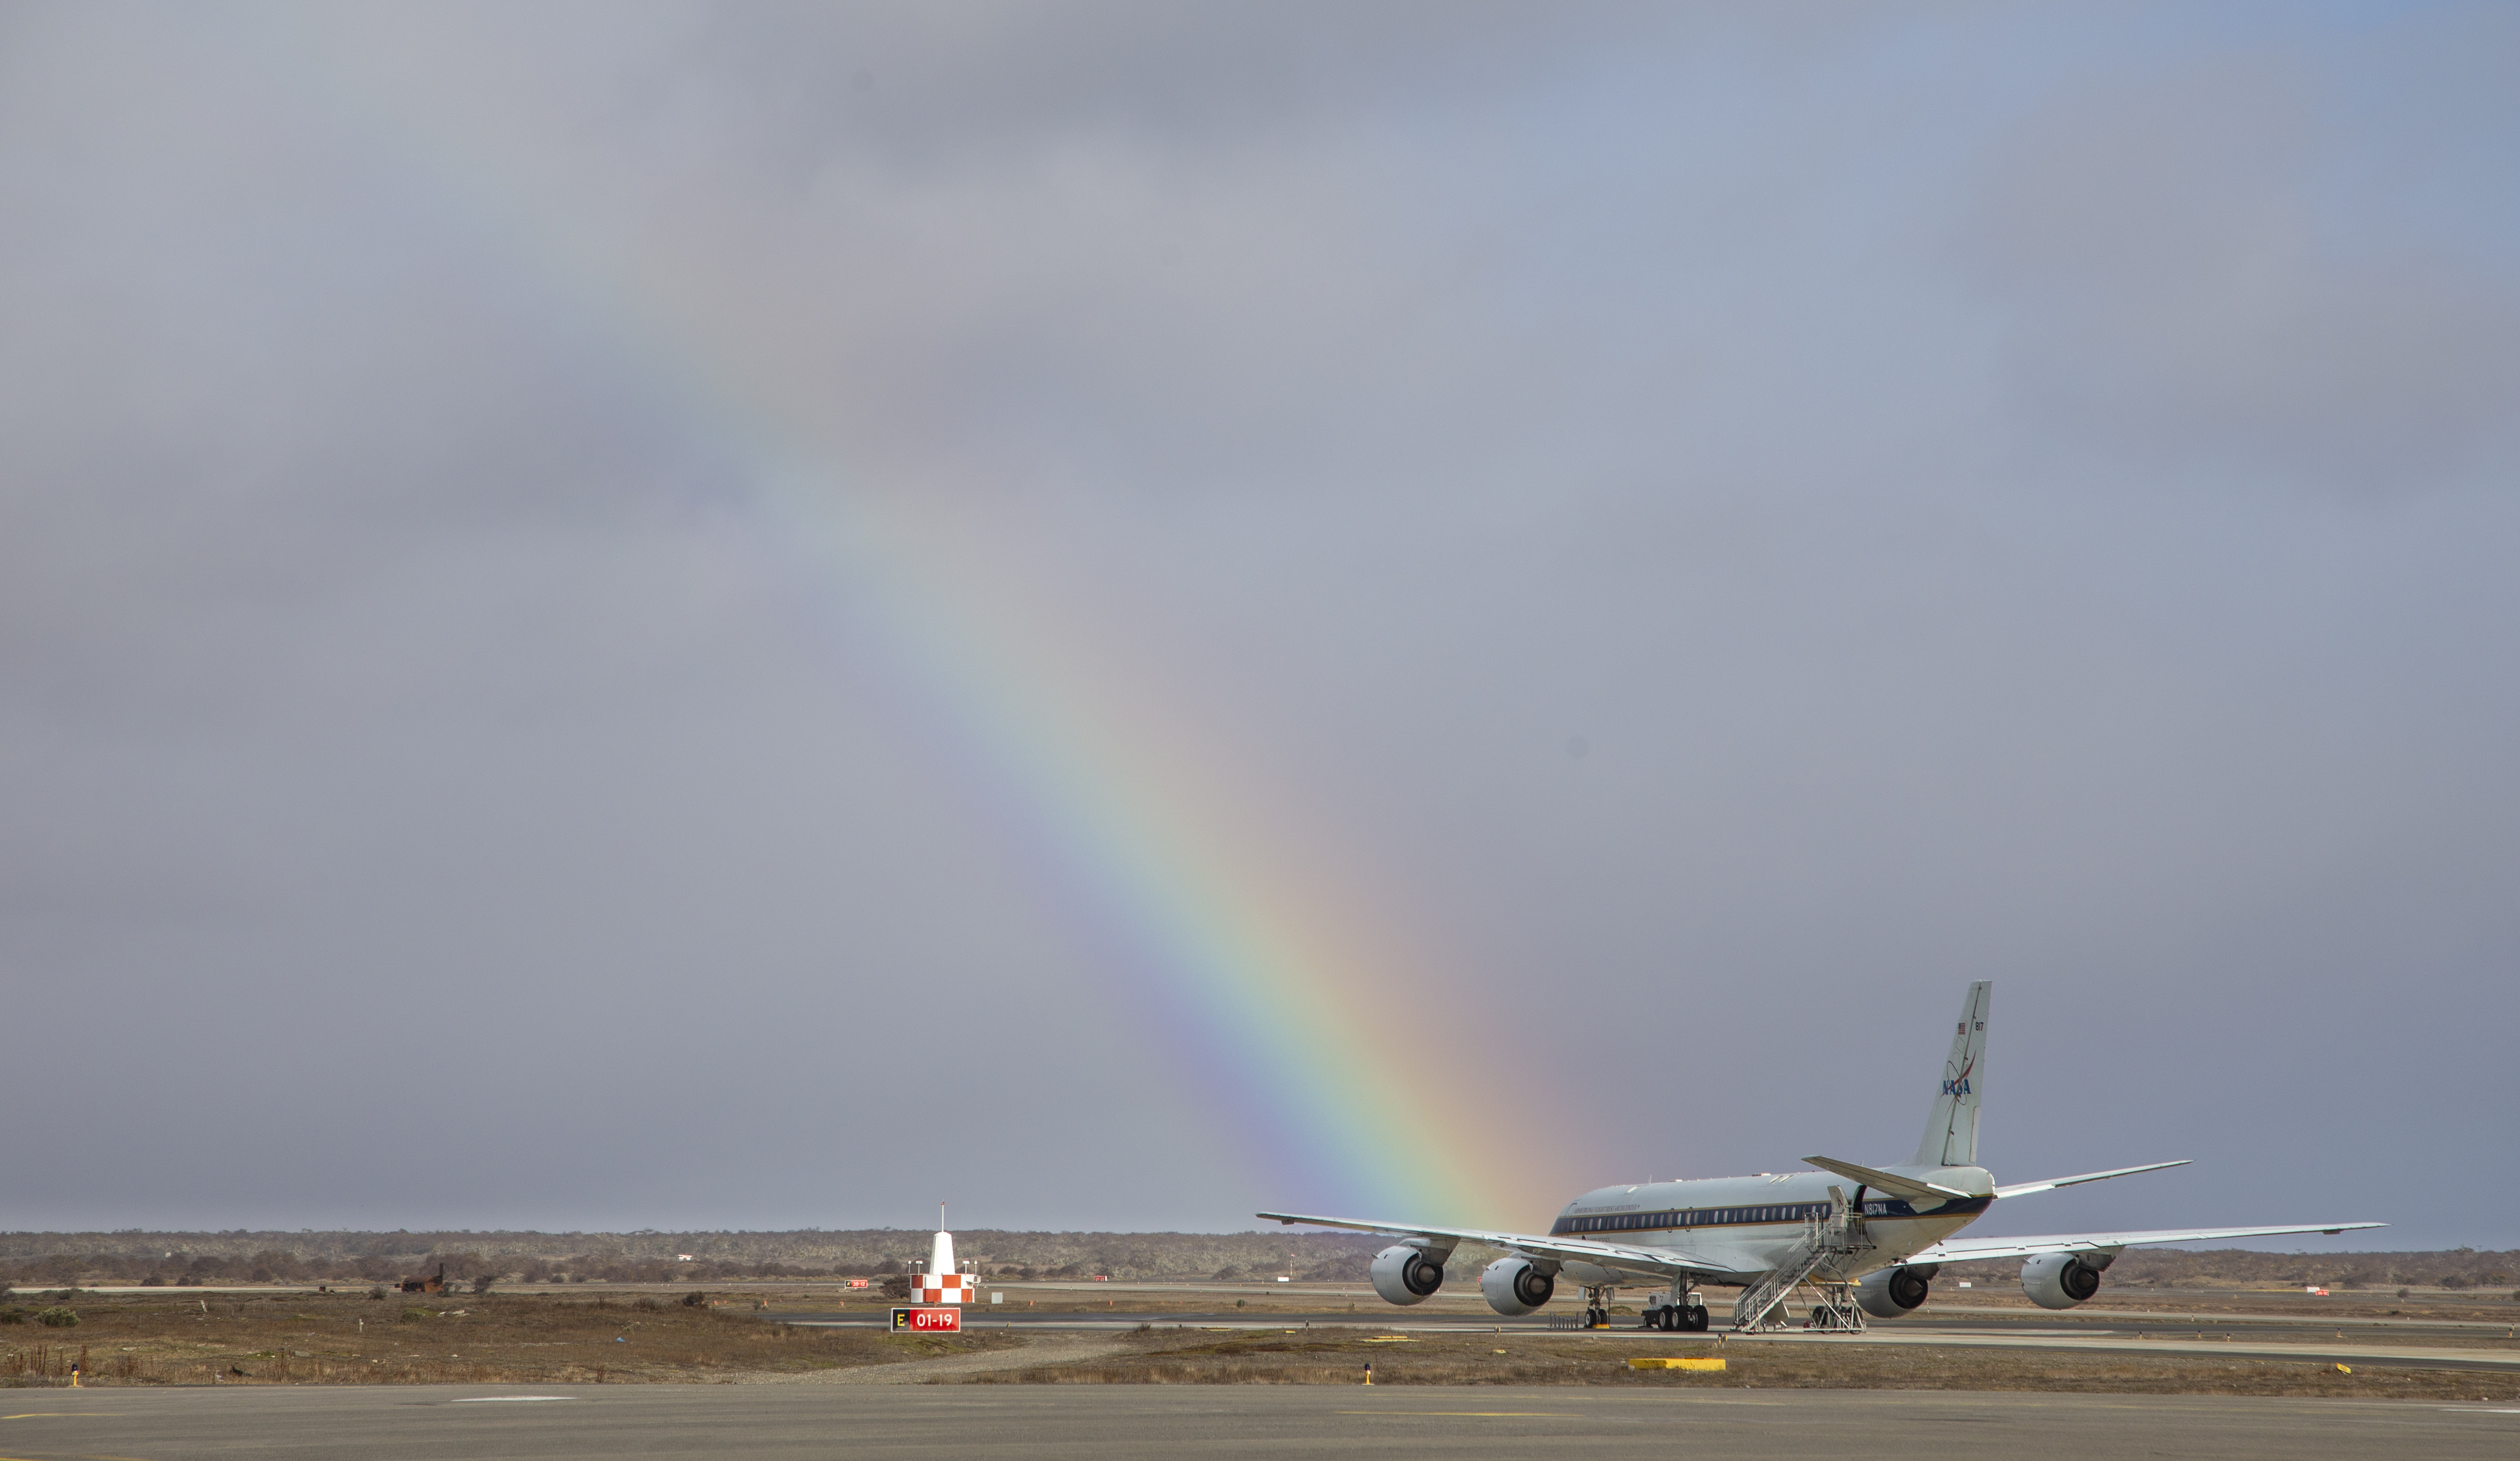
A rainbow appears in the backdrop of NASA’s DC-8 at the Punta Arenas Airport in Chile before takeoff. Credits: NASA/Jeremy Harbeck

by Linette Boisvert / SKIES ABOVE ANTARCTICA /

NASA’s Operation IceBridge (OIB) fall campaign in the Antarctic  has been a much different experience for me compared to past campaigns. This is in part because of my new role and responsibilities as deputy project scientist for OIB, but also because I am currently in the southern hemisphere for the first time and seeing Antarctic sea ice and land ice for the first time in person! If that wasn’t enough new stuff, I am now spending 12 hours a day flying over Antarctica, almost nearing the South Pole. (That is the topic of a future blog…so stay tuned!)

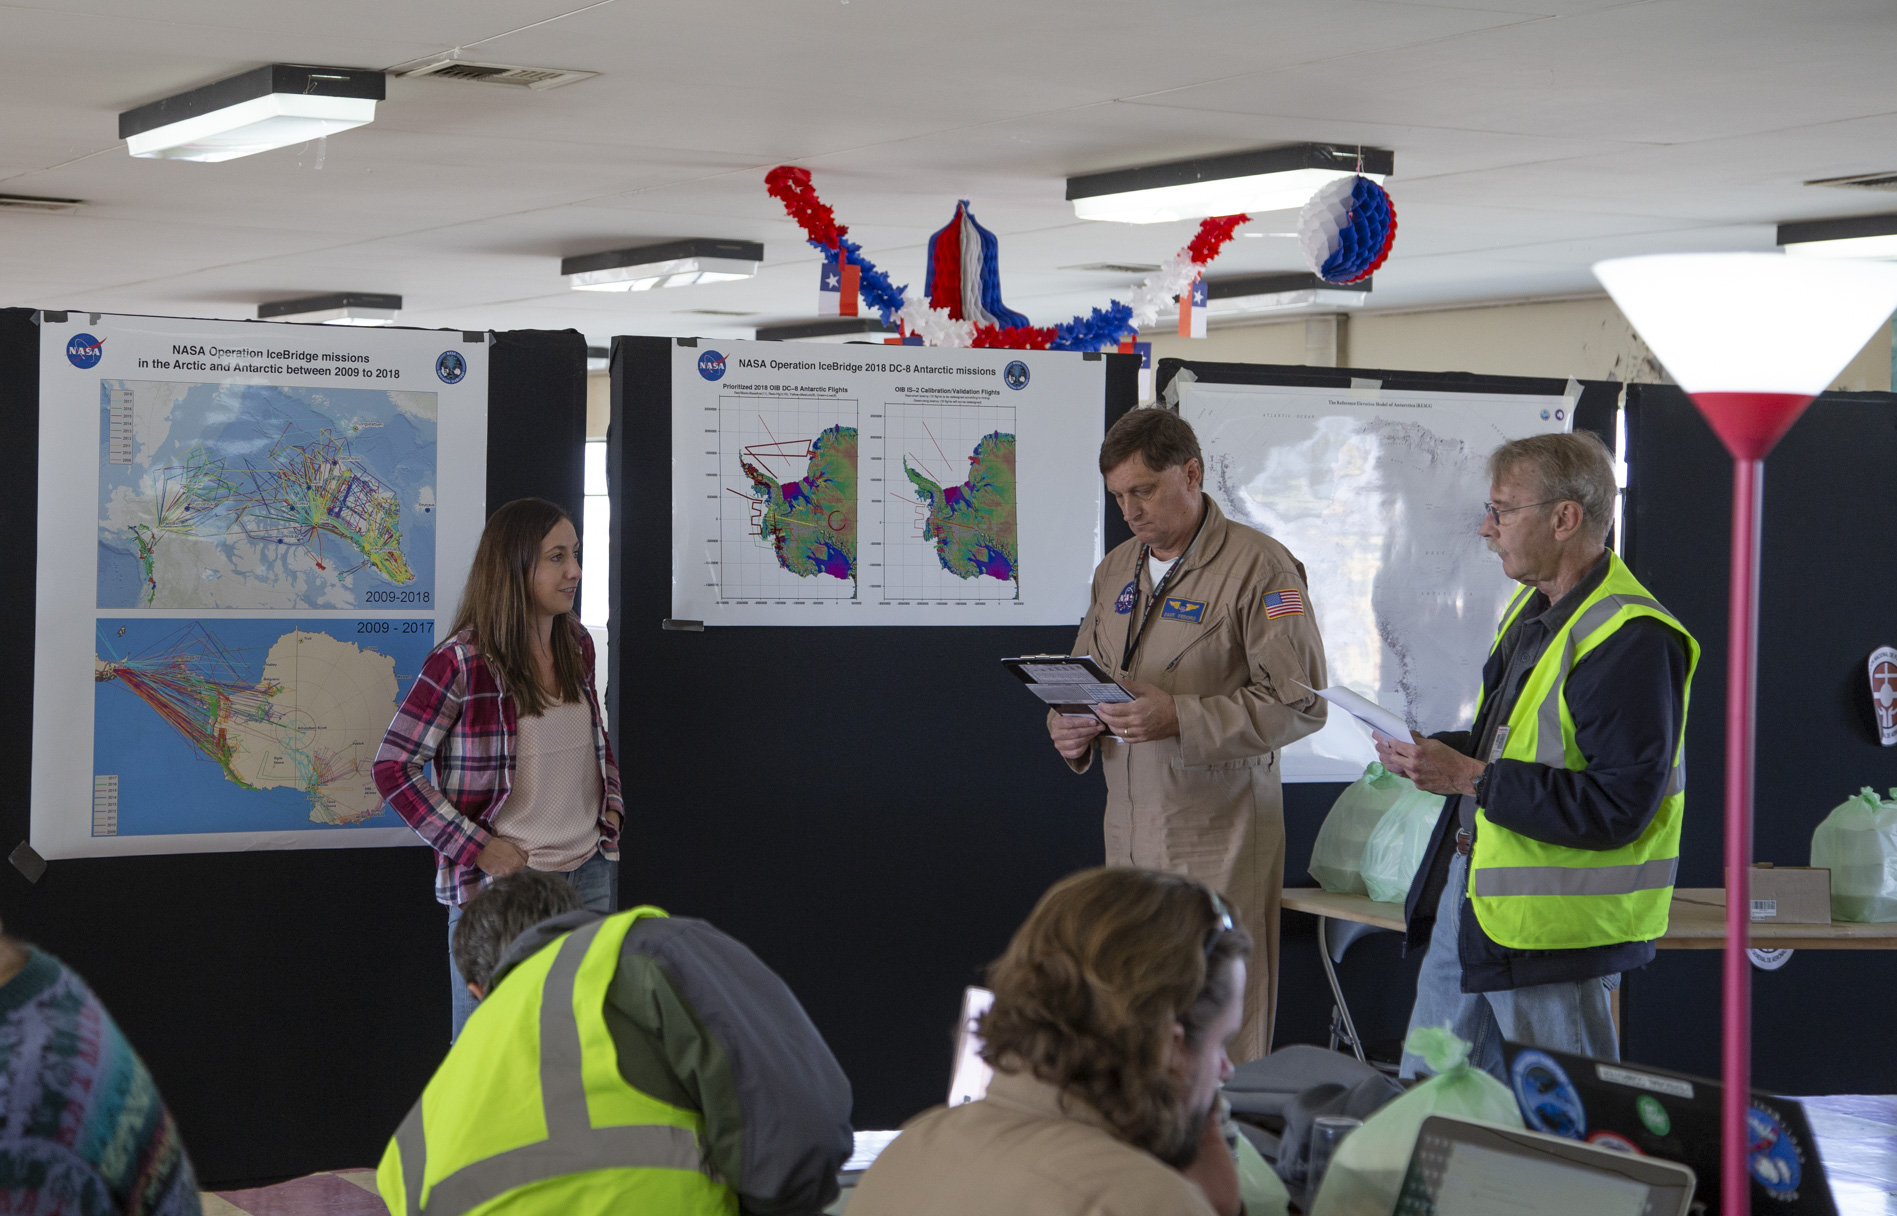
Lynette Boisvert (left) doing an OIB pre-mission briefing on the science objectives with the pilots and instrument team members. Credits: NASA/Jeremy Harbeck

These flights are long (I mean really long) and the days are also long. We have to get to the airport two hours before the flight, and it takes about 25 minutes to get to the airport in Punta Arenas, Chile. Once there, John Sonntag, Eugenia DeMarco, and I go over the satellite imagery available to us as well as some weather forecast models of Antarctica so we can decide which missions are the most viable for maximum data collection during flight.

This is nerve-wracking in two ways: 1) We have limited satellite imagery so the model forecasts don’t always get the weather correct. This is because there are relatively few observations for the models to ingest in Antarctica and the Southern Ocean to include in their forecasts. Basically, the more observations available the better the chance that the models will get the weather forecasts correct. 2) If we make the wrong call and pick a mission where the weather turns out to be different from the forecasts and we are unable to collect good data, we are wasting the project’s valuable flight hour time and money. Let’s just say flying a big plane like the DC-8 is not cheap. So that’s a lot of pressure.

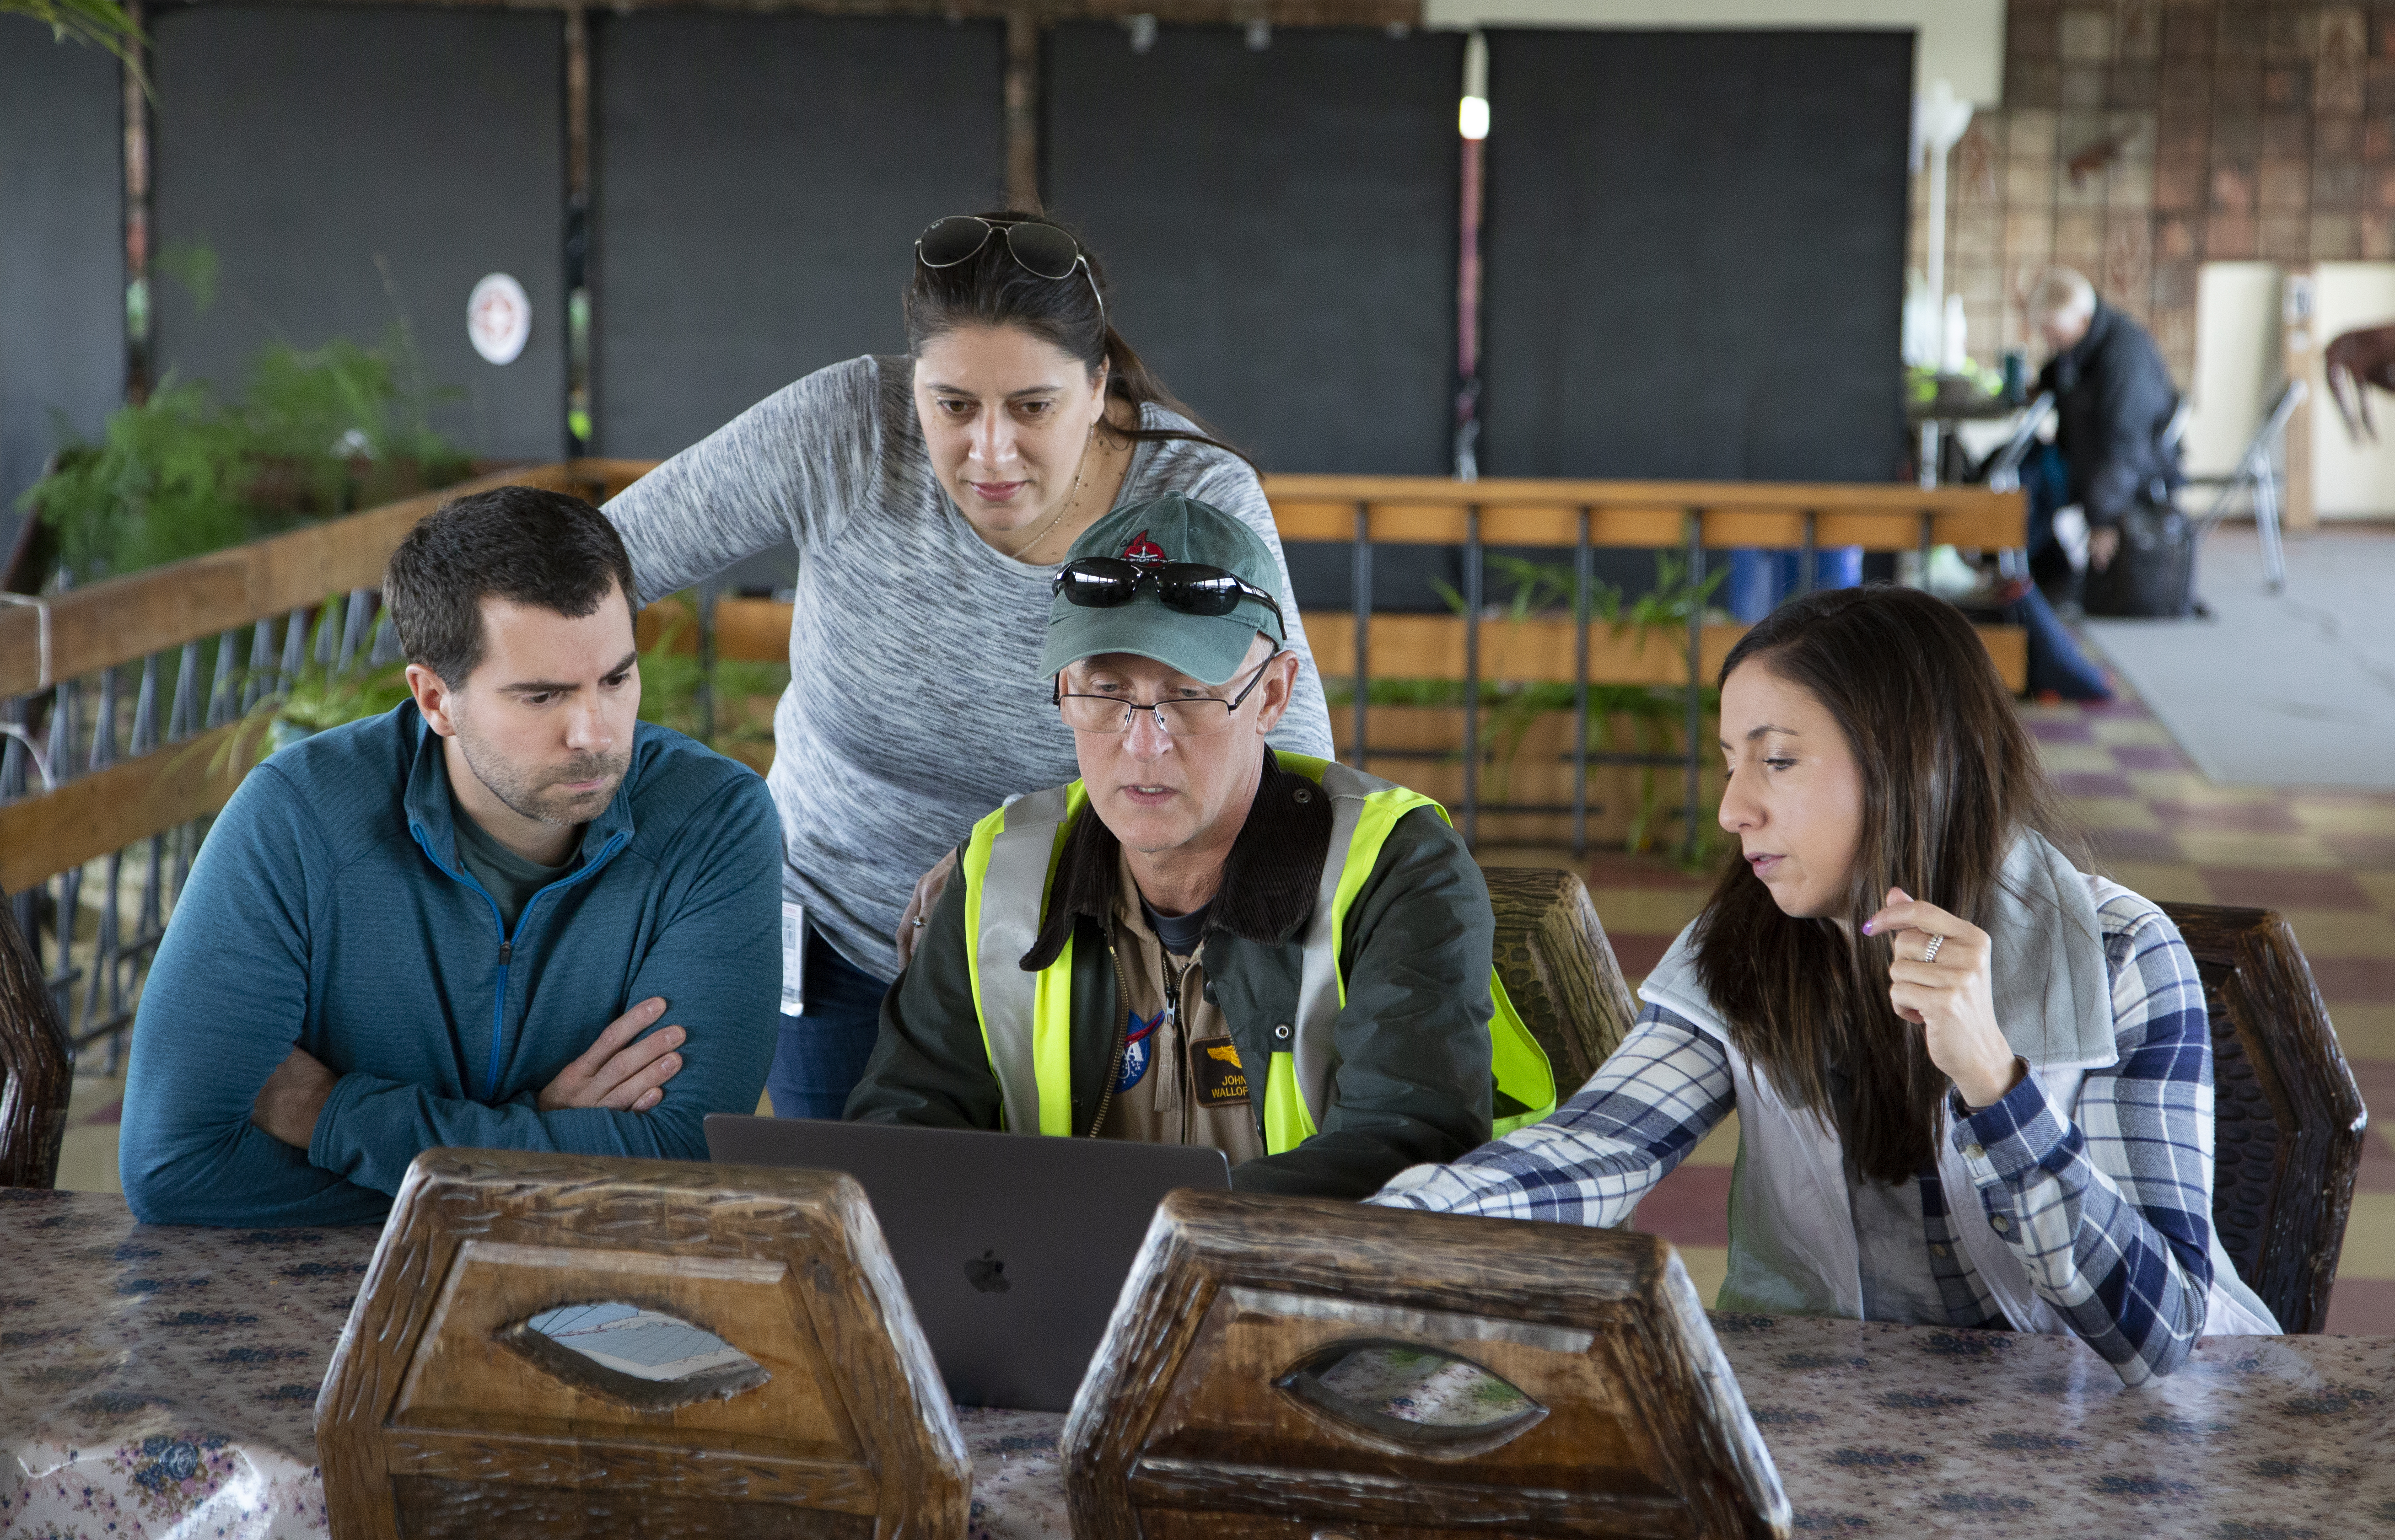
Assessing the forecasts and deciding on a science mission first thing in the morning at Punta Arenas airport from right to left: Joe McGregor, Eugenia DeMarco, John Sonntag and Linette Boisvert. Credits: NASA/Jeremy Harbeck

The reason why our flights are much longer in the Antarctic compared to the Arctic is that the time it takes to get to Antarctica from where we are based, Punta Arenas, is two to hours hours long, meaning that’s how long it takes before we can begin our mission and collect data. About half of our flight time is high-altitude transit. One would think there would be a lot of down time; however, for me this is not the case. I am very big on outreach and giving back by sharing with students of all ages what I do in my job, how I got interested in science, and the science that I do. One of the great things about OIB and NASA airborne science in general is that we have the ability to connect and chat with students in classrooms all over the world during our flights.

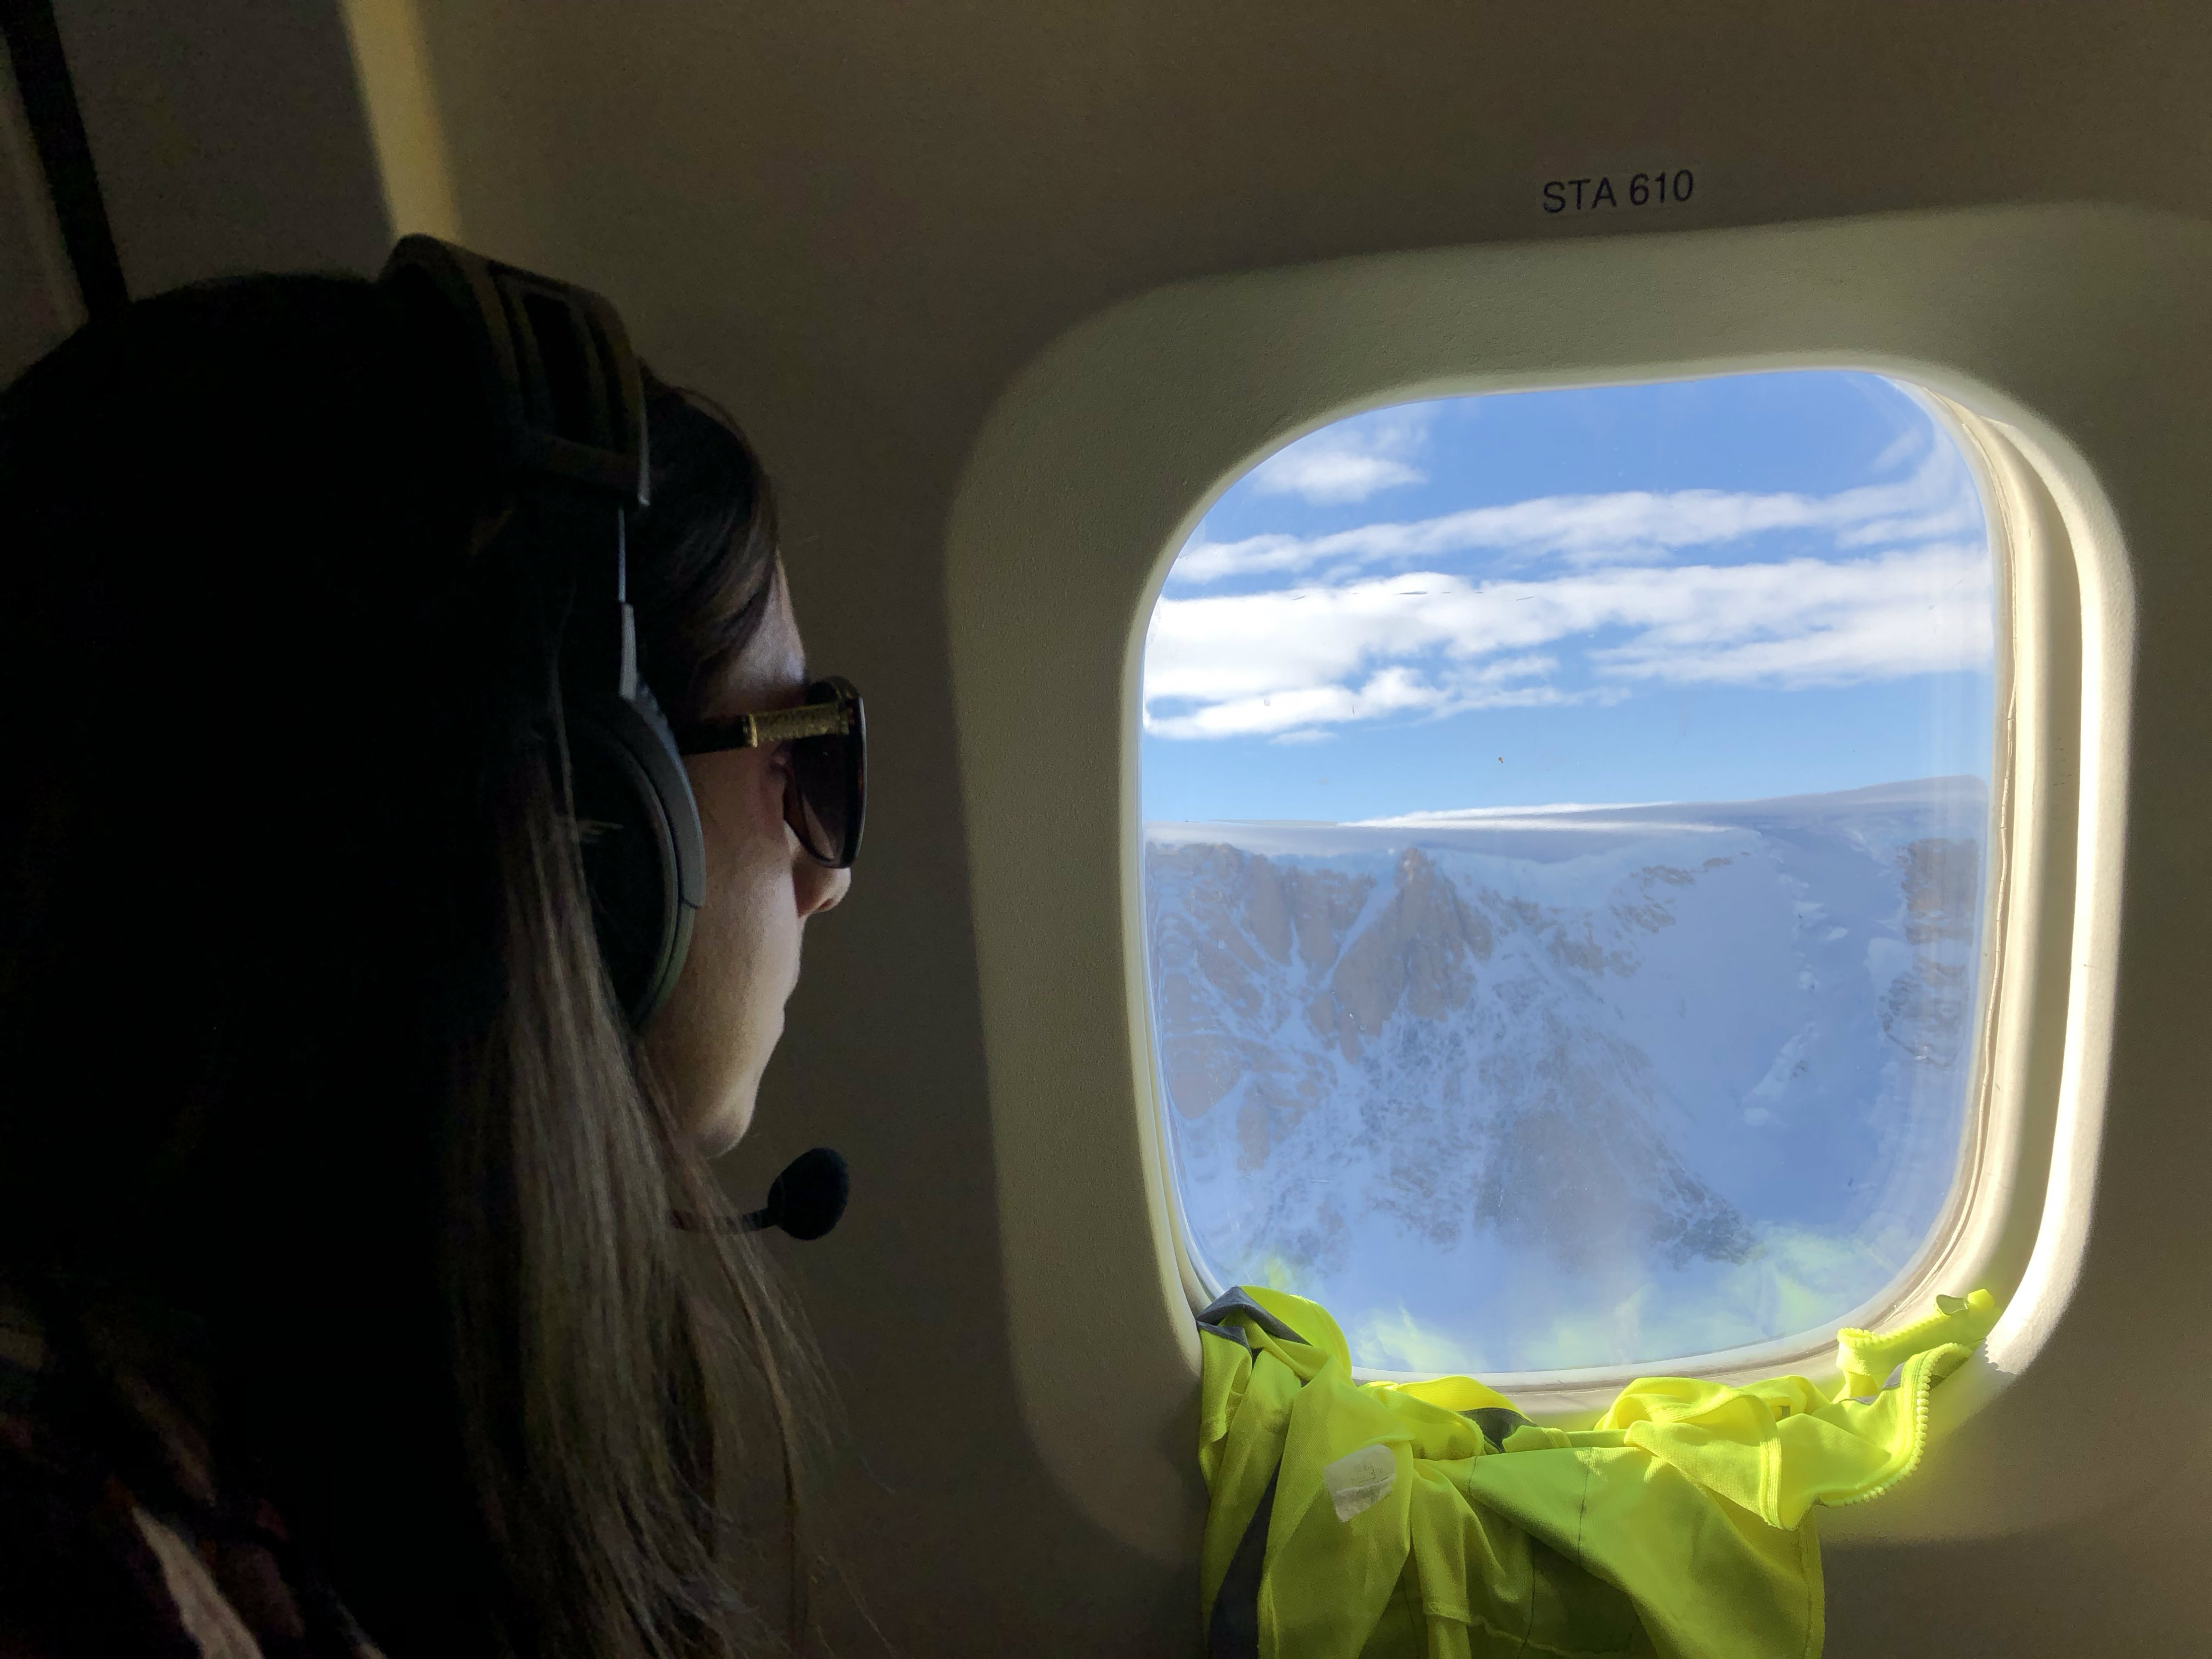
Linette Boisvert looking out of the DC-8 window at mountains of the North Antarctic Peninsula during an IceBridge science mission. Credits: Eugenia DeMarco

So this is how I choose to spend my down time on science flights. Teachers can connect their classrooms with us and ask all types of questions, from climate change to what OIB does, what we studied in school, and what we eat on the plane. I have been partaking in this for a few campaigns now, and the majority of the teachers come back campaign after campaign, connecting with us multiple times.

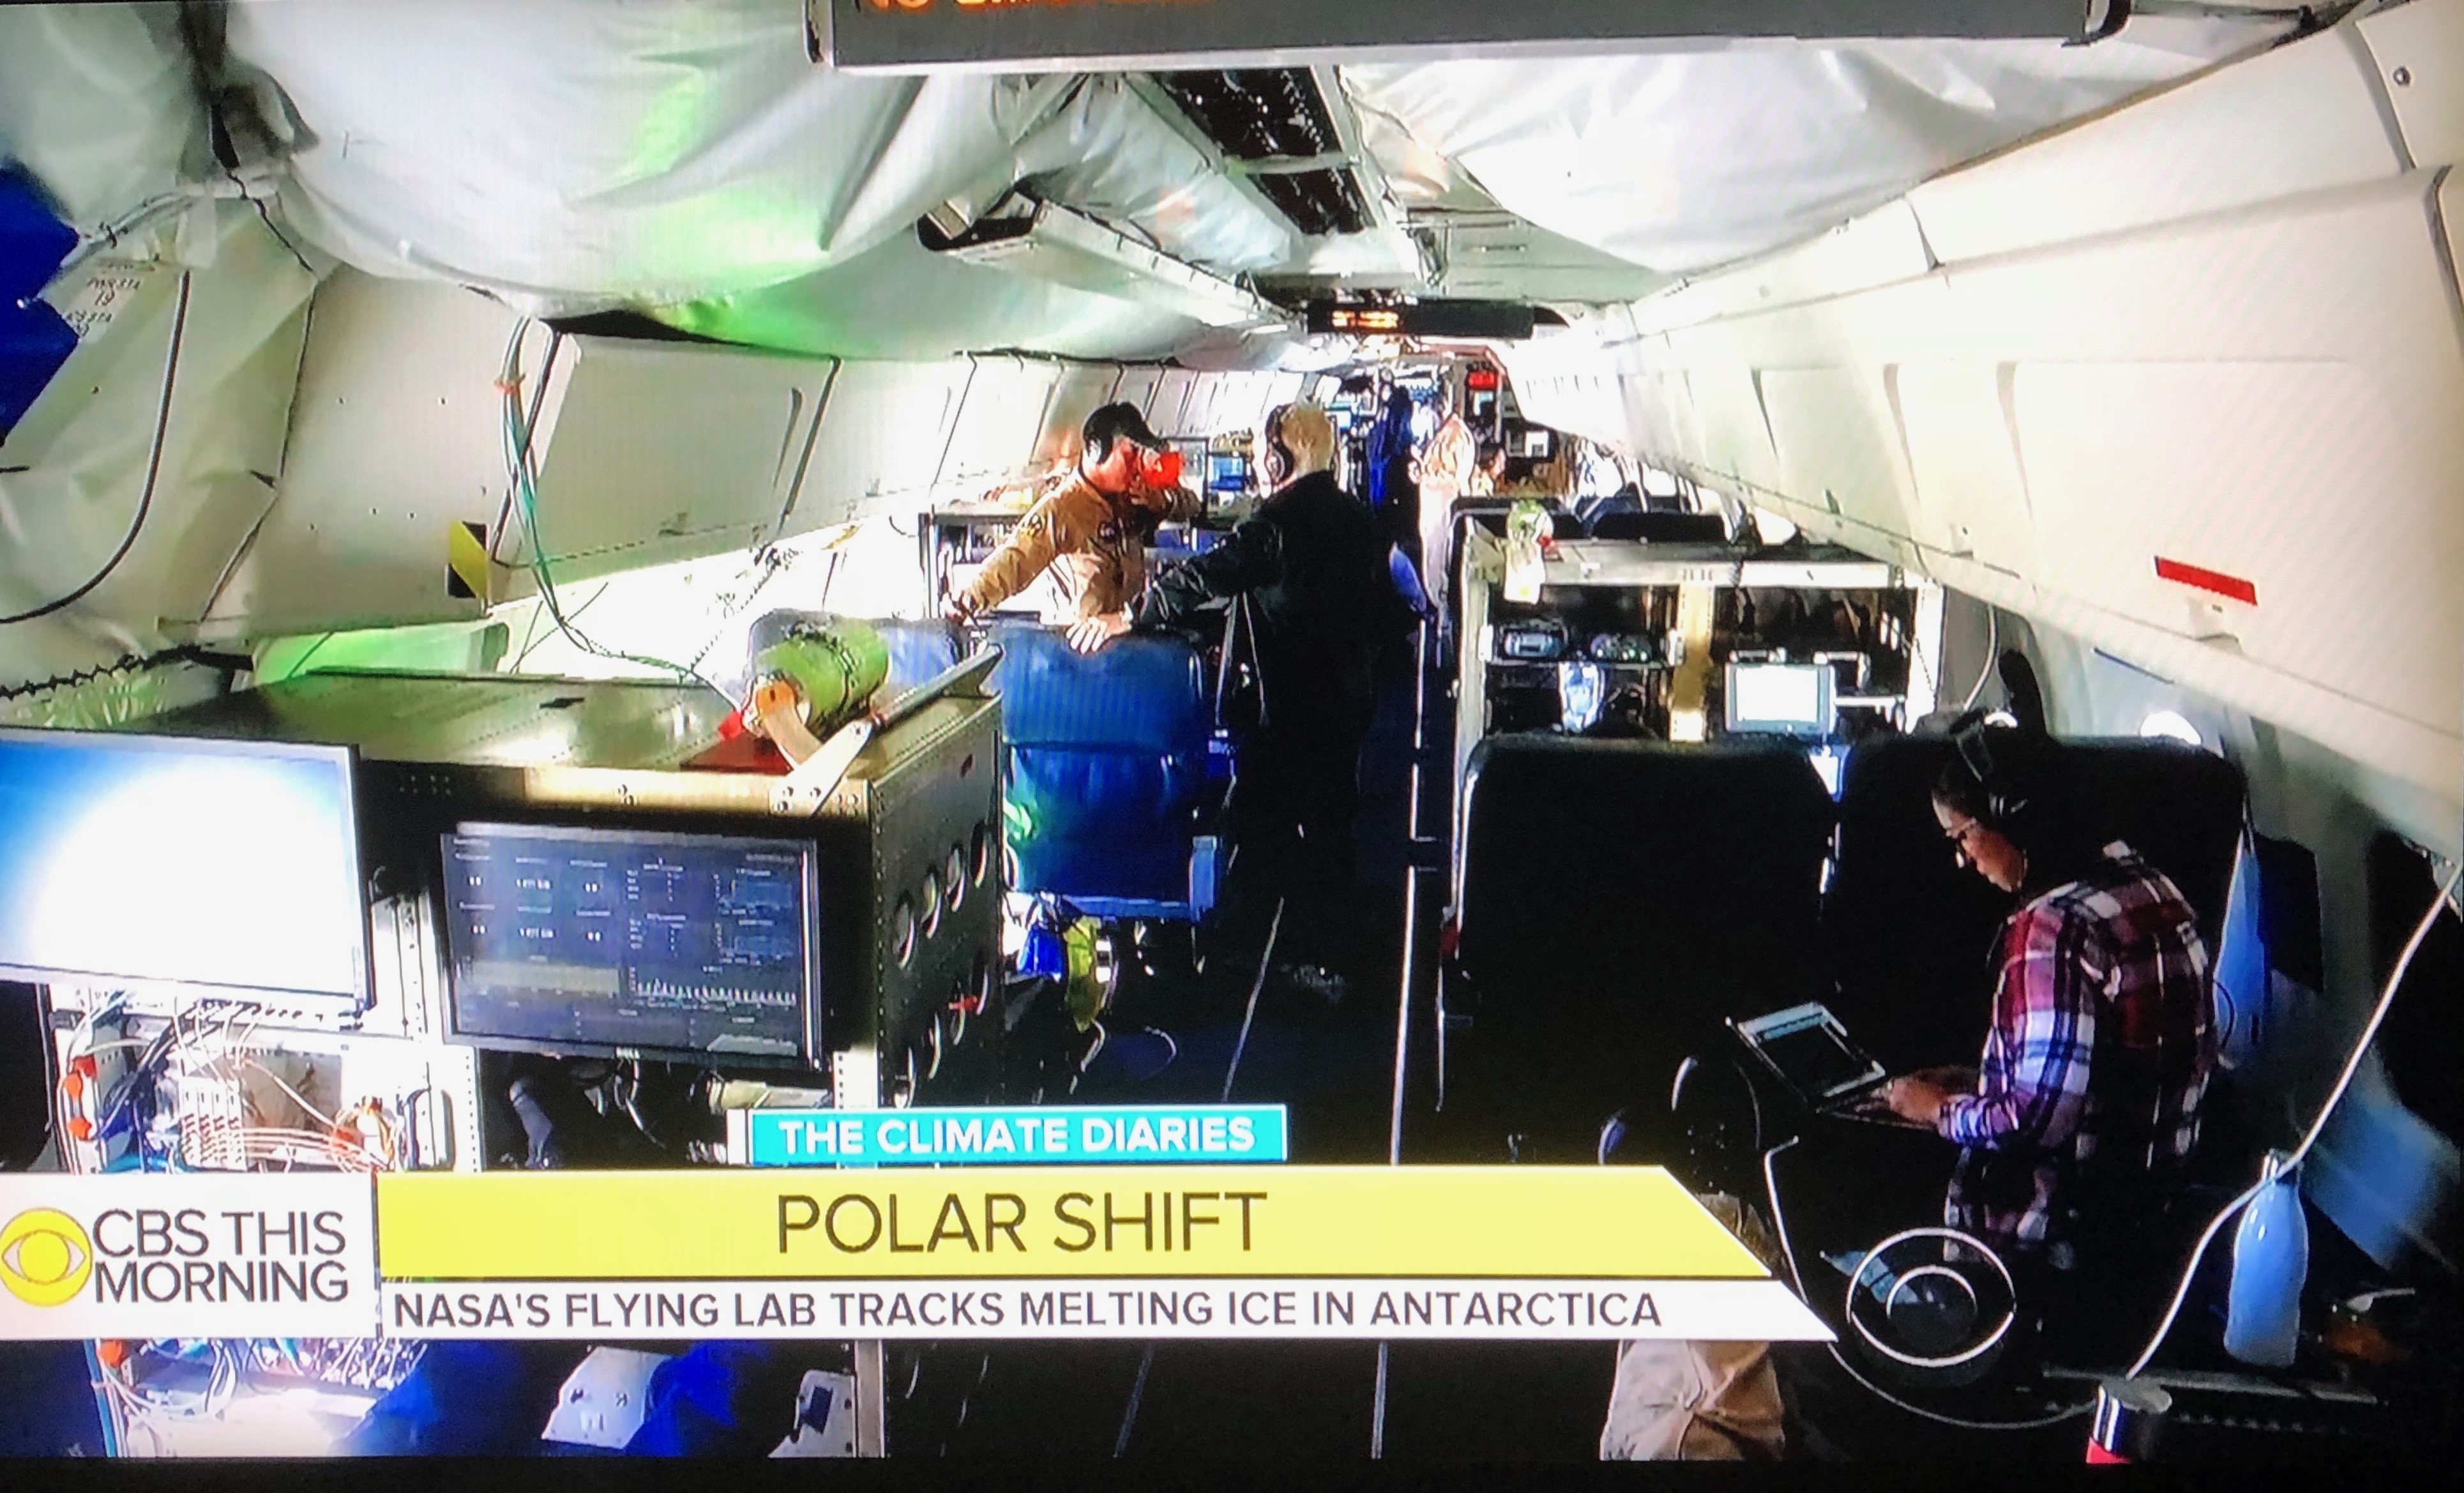
Linette Boisvert (foreground) taking part in a classroom chat during a science mission. This image was taken from a clip that was shown on CBS Evening News. Credits: NASA/Linette Boisvert

One of these teachers is Marci Ward, who teaches third grade in Fairbanks, Alaska, and is fascinated with airborne science and is dedicated and enthusiastic about exposing her students to all types of science. Last spring, when we were stationed in Fairbanks for our Beaufort sea ice flights, I had the opportunity to go to her classroom and talk to her students in person about OIB on one of our down days. Shortly thereafter, I was able to connect with her students again on the plane chat the following week. They were so excited to meet me in person and to chat with me on the plane, it really made me feel good about what I was doing and that I was making a difference (aka giving me the warm and fuzzies inside).

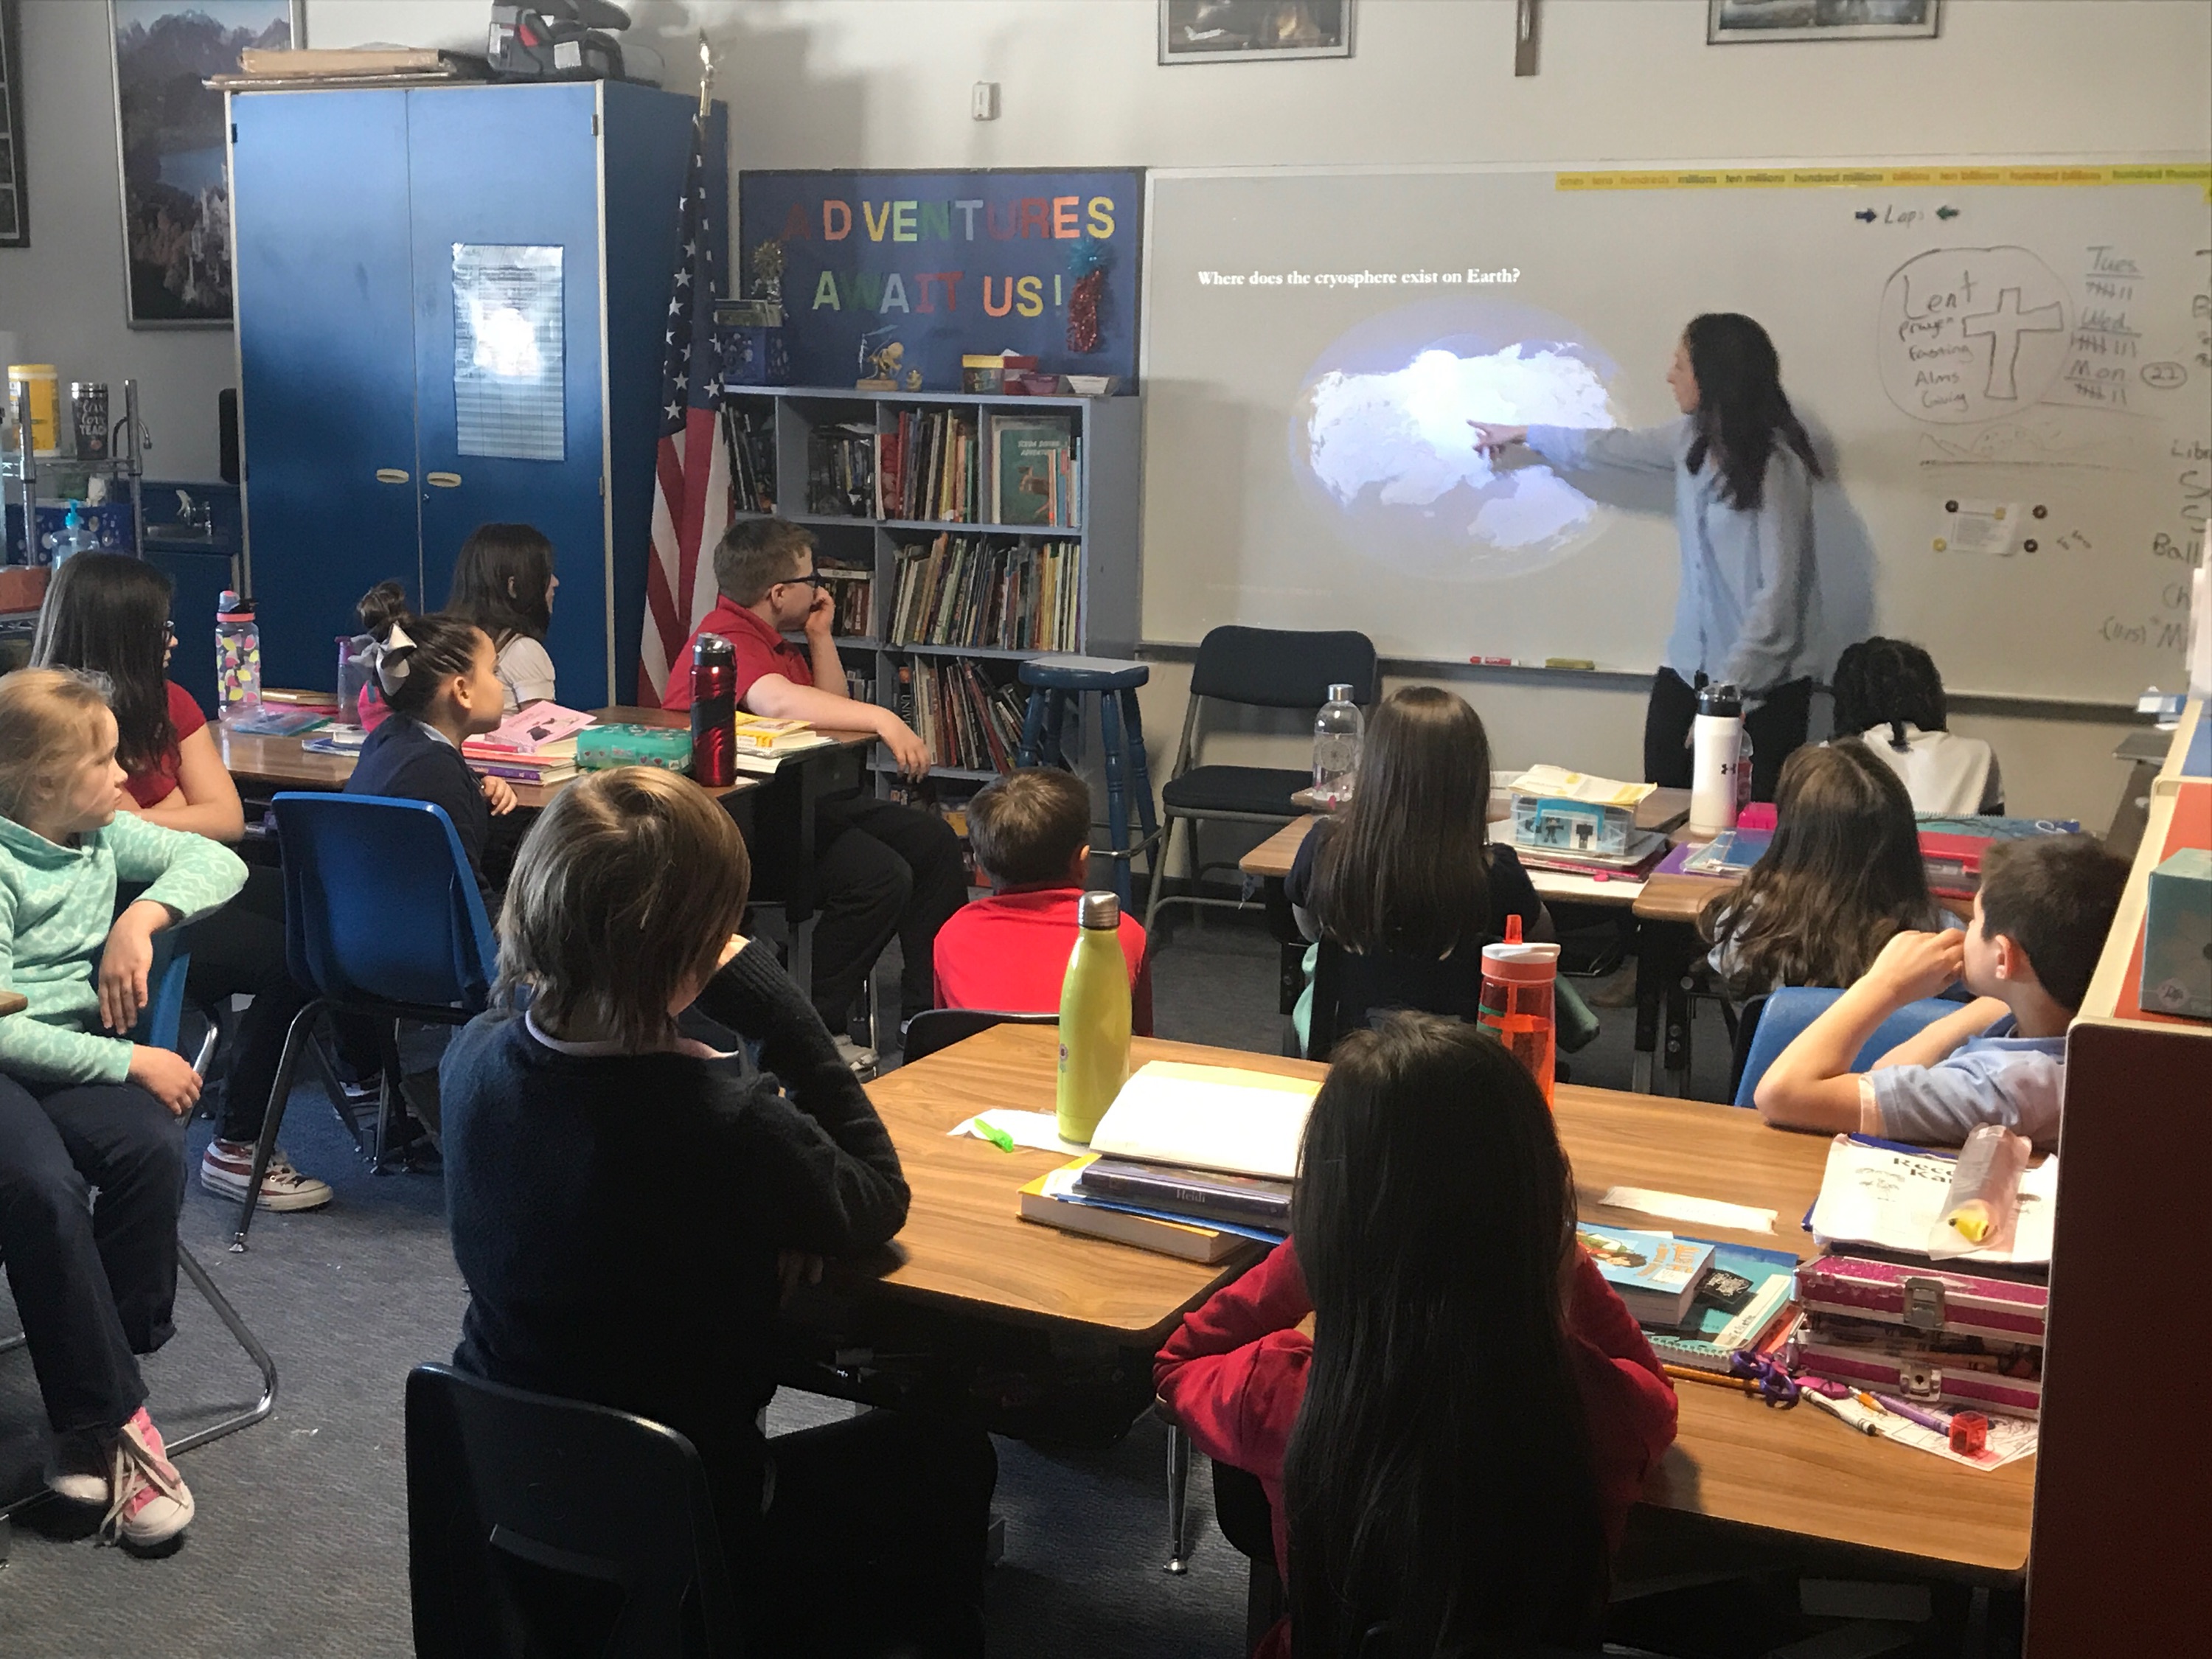
Linette Boisvert talking to Marci Ward’s third grade class in Fairbanks, Alaska, about sea ice and IceBridge in March 2018 during the Arctic spring campaign. Credits: NASA/Emily Schaller

It is very humbling to know that you can have such an impact on students and hopefully inspire and motivate them to pursue a career in science, math, or whatever subject they are passionate about. And it is even better when we receive feedback from the students and teachers, such as Janell Miller, a middle school teacher located in a high-poverty area of central California. “Believe me, your outreach matters to students,” she said. “It brings in a whole world they would not have been able to access first hand. The IceBridge project—speaking with scientists and engineers—this has a lasting impact. I’ve had former students who participated in this chat years ago, when I taught elementary school, write that this was one of their best school memories in their senior papers.”

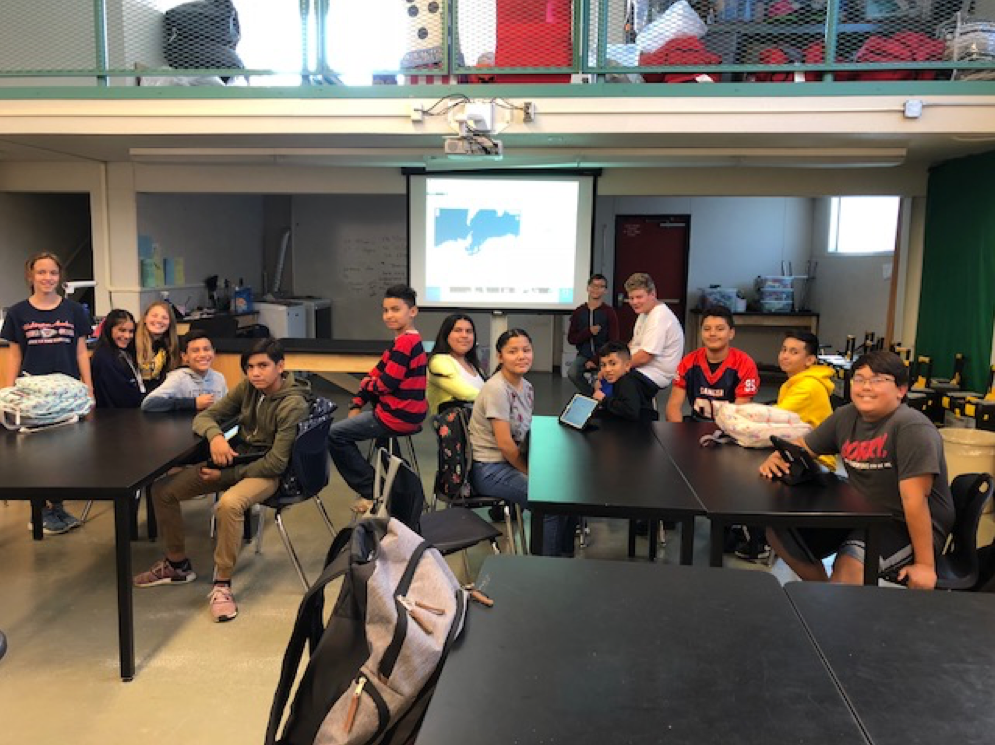
Seventh and eighth graders at Washington Academic Middle School in Sanger, California, connected live to the NASA IceBridge team aboard the DC-8. Credits: NASA/Emily Schaller

After 12 hours in the air today, we arrive back in Punta Arenas and make it back to our hotel anywhere from one to two hours after we land. The days can be exhausting, and we know that we will be doing this all again tomorrow. But I also know that along with collecting all of this extremely valuable data of Antarctic ice, I and other scientists and engineers aboard also make an impact on students all over the world. Personally, I find it even more important for me to be continually proactive in the student chats because I hope to encourage and inspire young female students to be interested and pursue careers in math and science, areas where we are currently underrepresented and crucially needed.

The NASA DC-8 plane arriving back at the Punta Arenas airport after a 12-hour science mission. Credits: NASA/Linette Boisvert

Refining How We See Aerosols, Clouds, and Precipitation in Climate’s Big Picture

By Andrew Dzambo / SÃO TOMÉ AND PRÍNCIPE /

Andrew is a PhD student at the University of Wisconsin-Madison.

Crew and scientists preparing for the October 2, 2018 research flight aboard the NASA P-3 aircraft. Pictured: Amie Dobracki, University of Miami. Photo Credit: Andrew Dzambo

Climate models are essential tools to predict climate’s evolution in the next few decades and beyond. Given current computational capabilities, most global models cannot resolve every scale and process; therefore, we often parameterize (i.e. simplify) the mathematical representation of the processes to obtain results in a reasonable amount of time.

Cloud processes are among the most difficult to parameterize for a number of reasons: clouds form on many different spatial scales, have highly variable time scales, and require simultaneous knowledge of a large number of factors that affect their evolution. Precipitation processes are even harder to capture in climate models because they occur on more highly variable spatial and time scales.

Additionally, the presence of aerosols, such as smoke or dust, further complicates the problem because aerosols’ effects on cloud and precipitation processes often depends on the type and amount of aerosol present.  Overall, our knowledge of how aerosols interact with clouds and precipitation is highly uncertain, especially over remote areas like the ocean. In order to better understand these processes and their impacts on the global radiation and energy budgets – essentially, how heat moves around our planet – we require highly accurate measurements of these aerosol and cloud interactions.

Group picture of some of the science crew from the transit between Sal, Cabo Verde to Sao Tome: Andrew Dzambo (front), Amie Dobracki (middle-left), Art Sedlacek (middle-right), David Harper (back-top), Sam LeBlanc (back-middle), and Tony Cook (back-bottom). Photo Credit: Andrew Dzambo
Group picture of some of the science crew aboard NASA’s P-3 research aircraft from the transit between Sal, Cabo Verde to Sao Tome: Andrew Dzambo (front), Amie Dobracki (middle-left), Art Sedlacek (middle-right), David Harper (back-top), Sam LeBlanc (back-middle), and Tony Cook (back-bottom). Photo Credit: Andrew Dzambo

NASA’s Observations of Aerosols above Clouds and their Interactions, or ORACLES, field campaign has set out to do just that. We are collecting a highly thorough, robust dataset aimed at challenging our current theories about cloud/aerosol interactions and how aerosols affect cloud and precipitation processes in stratocumulus clouds. These clouds might not be as visually stunning as ones associated with severe weather, but to atmospheric scientists, they are very important because they cover a large fraction of Earth’s subtropical oceans and have a large impact on earth’s energy budget. The ORACLES campaign, taking place over the Southeast Atlantic Ocean, bridges an observational data gap where ground and airborne observations are presently limited.

On the October 3, 2018 research flight, the biomass-burning (aerosol) layer is seen just above the stratocumulus cloud deck. Photo Credit: Andrew Dzambo

Weather radars were first developed during World War II, and radar technology has since expanded considerably. In the United States, WSR-88D radars are capable of observing (nearly) the entire country and are capable of notifying meteorologists of impending rain, snow, or destructive storms. But these radars are designed primarily to detect rainfall or ice particles larger than a small drizzle droplet. However, stratocumulus clouds are made up of even tinier cloud droplets, so the weather radar is not the best observing tool for them. Instead we need a radar system specifically designed for cloud detection.

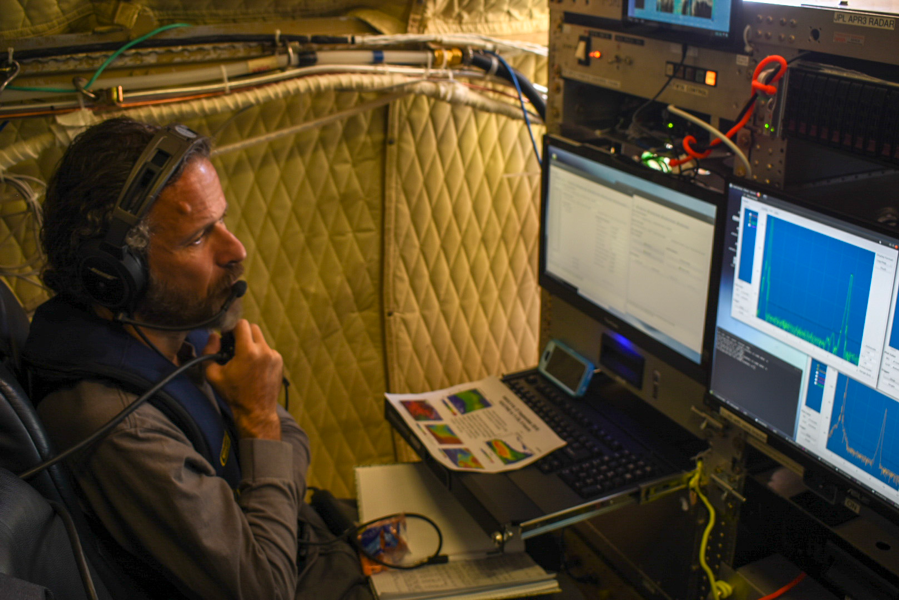
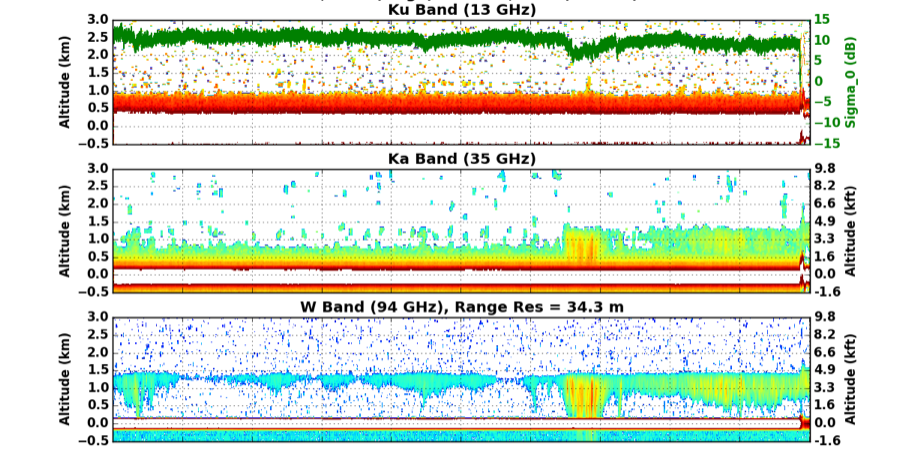
Enter the NASA Jet Propulsion Laboratory’s 3rd generation Airborne Precipitation Radar (APR-3). With development beginning back in 2002, this radar system operates at three frequency bands used to measure thin clouds and light precipitation (W-band), light to moderate precipitation (Ka-band) and moderate to heavy precipitation (Ku-band). This is the first airborne radar system capable of measuring the atmosphere at three frequencies for the same location, which means it can simultaneously detect clouds and precipitation.

During the ORACLES campaigns from 2016 through 2018, the stratocumulus cloud decks we see most often frequently go undetected by the lower frequency Ku and Ka channels. But by including the high frequency W-band radar we can now see the stratocumulus cloud and characterize its structure at a very high resolution.

Simone Tanelli (Jet Propulsion Laboratory) operating the APR-3 radar. Photo Credit: Andrew Dzambo

Occasionally, the APR-3 system in ORACLES measures both the cloud and precipitation. Detecting precipitation in multiple radar frequencies is useful as the high frequency W-band measurements commonly attenuates when precipitation gets too heavy – meaning the signal is somewhat lost because precipitating raindrops are too large. On the other hand, the other radar bands (usually Ka-band for ORACLES) can see this precipitation with little to no fading of the signal. The end result is that the multiple channels gives us the ability to better characterize the precipitation that’s happening. In turn, that gives us an opportunity to possibly provide a more accurate estimate of precipitation magnitude in these stratocumulus regions.

This is an example of both precipitating and non-precipitating stratocumulus as seen by the APR-3 radar. The highly sensitive cloud radar (W band, bottom) sees both the clouds and precipitation, whereas the Ka (middle) sees only precipitation and the Ku band (top) sees only the heaviest precipitation. Yellows, oranges and reds indicate precipitation, and blues/greens indicate clouds. The white bar at 0 kilometer/kilofeet (1000 feet) altitude shows the surface. Image Credit: Andrew Dzambo

The ORACLES APR-3 contributes one component of a highly robust dataset designed to study the effects of aerosols on cloud and precipitation processes. Other direct and remote sensing instruments from the ORACLES field campaign collect highly detailed information about aerosol type and amount in the atmosphere – both of which are needed to properly assess cloud/aerosol interactions and their net effect on precipitation. Ultimately, ORACLES will greatly improve how we describe aerosol/cloud/precipitation interactions in future climate models.

Students Traverse Land, Air, and Water in Canada with NASA’s ABoVE

Joanne Speakman helps scientists map wetlands near the city of Yellowknife in the Northwest Territories, Canada. Credits: Paul Siqueira

by Joanne Speakman / NORTHWEST TERRITORIES, CANADA /

My name is Joanne Speakman and I’m from the Northwest Territories (NT) in Canada. I’m indigenous to the Sahtu Region and grew up in Délįne, a beautiful town of about 500 on Great Bear Lake. Now I live in Yellowknife, NT, and study environmental sciences at the University of Alberta. I was a summer student this year with the Sahtu Secretariat Incorporated (SSI), an awesome organization in the NT that acts as a bridge between land corporations in the Sahtu. My supervisor, Cindy Gilday, helped organize a once-in-a-lifetime opportunity for me and a fellow student from Délįne, Mandy Bayha, to fly with NASA. It was a dream come true.

One of NASA’s projects is called the Arctic-Boreal Vulnerability Experiment (ABoVE), which is studying climate change in the northern parts of the world. People from the circumpolar regions have seen firsthand how drastically the environment has changed in such a short period of time, especially those of us who still spend time out on the land. Weather has become more unpredictable and ice has been melting sooner, making it more difficult to fish in the spring. Climate change has also contributed to the decline in caribou, crucial to Dene people in the north, both spiritually and for sustenance.

Studies like ABoVE can help explain why and how these changes are happening. Along with traditional knowledge gained from northern communities, information collected by ABoVE can go a long way in helping to protect the environment for our people and future generations.

Wednesday, August 22, 2018:

Joanne Speakman sits behind the pilots during takeoff. Credits: Mandy Bayha

It was exciting to meet the ABoVE project manager, Peter Griffith, and the flight crew because it’s amazing what they do, and to fly with them was an incredible opportunity to learn from one another. Although we were from different parts of the world, at the end of the day we are all people who care about taking care of the environment. We flew on a Gulfstream III jet to survey the land using remote sensing technology. We flew from Yellowknife to Kakisa, Fort Providence, Fort Simpson and then back to Yellowknife.

During the flight, crew ran the remote sensing system and they explained to us how it works. It got complicated pretty quickly, but from what I understood, a remote sensor is attached to the bottom of the plane and sends radio waves to the ground and bounce back, providing information about the land below and how it is changing from year to year.

The pilots, Terry Luallen (left) and Troy Asher, make flying look easy. It was remarkable to see them work and to listen to them over the headset, says Speakman. Credits:
At work in the Gulfstream III jet are flight engineer and navigator Sam Choi from NASA’s Armstrong Flight Research Center and radar operator Tim Miller from NASA’s Jet Propulsion Laboratory. Credits: Joanne Speakman
From left: NASA pilot Terry Luallen, Mandy Bayha, NASA ABoVE Chief Support Scientist Peter Griffith, Joanne Speakman, NASA pilot Troy Asher.

August 24, 2018

NASA’s also working on building a satellite called the NASA-ISRO Synthetic Aperture Radar, or NISAR, which will help study the effects of thawing permafrost. Two of the lead scientists working on NISAR are Paul Siqueira and Bruce Chapman. While they were in Yellowknife, Mandy and I got invited to join them for a day to help collect field data.

Rock climbing isn’t the easiest in rubber boots, but Joanne Speakman and Paul Siqueira make it safe and sound. Credits: Mandy Bayha

We met with Paul and Bruce early in the morning and then drove out on the Ingraham Trail until we reached a small, marshy lake. We got out and walked along the lake’s edge, making measurements of the amount of marshy vegetation from the shore

Joanne Speakman admires a stunning view after the climb. The Northwest Territories has so many hidden gems, she says. Credits: Paul Siqueira

to the open water, an area that I learned is called inundation. We used our own estimations and also a cool device that uses a laser to tell you exactly how far away an object is. Paul and Bruce will use the information we collected that day to figure out the best way to map wetlands, which will help the ABoVE project study permafrost thaw and help with development of the NISAR satellite by comparing our results to satellite images of the area.

Mandy Bayha and Joanne Speakman use their canoeing skills. With them is NASA scientist and engineer Bruce Chapman, who Joanne is excited to learn has spent time studying the surface of Venus. Credits: Joanne Speakman
University of Massachusetts Amherst scientist Paul Siqueira enjoys the last canoe ride of the day with Joanne Speakman and Mandy Bayha. Credits: NASA/Bruce Chapman

In the afternoon, we surveyed a second lake, this time using a canoe. The sun came out and we saw ducks, a juvenile eagle, and many minnows swimming around. Nothing’s perfect, but this day was close to it and we learned a lot along the way.

Meeting and spending time with the NASA team, especially Bruce, Paul, and Peter, was the highlight of the two days. They’re incredibly kind and thoughtful and took the time to share their knowledge with us. ABoVE is a 10-year program and I hope there will be many more opportunities for northern youth to participate in such an exciting, inspiring project. There is so much potential out there. Thanks again for an amazingly fun learning experience!