Prolonged Persistence of SARS-CoV-2 RNA in Body Fluids
Jiufeng Sun
1, Jianpeng Xiao
1, Ruilin Sun
1, Xi Tang
1, Chumin Liang, Huifang Lin, Lilian Zeng, Jianxiong Hu, Runyu Yuan, Pingping Zhou, Jinju Peng, Qianlin Xiong, Fengfu Cui, Zhe Liu, Jing Lu, Junzhang Tian

, Wenjun Ma, and Changwen Ke

Author affiliations: Guangdong Provincial Center for Disease Control and Prevention, Guangzhou, China (J. Sun, J. Xiao, C. Liang, H. Lin, L. Zeng, J. Hu, R. Yuan, P. Zhou, J. Peng, Q. Xiong, F. Cui, Z. Liu, J. Lu, W. Ma, C. Ke); Guangdong Second Provincial General Hospital, Guangzhou (R. Sun, J. Tian); First People’s Hospital of Foshan, Foshan, China (X. Tang)
Main Article
Figure 1

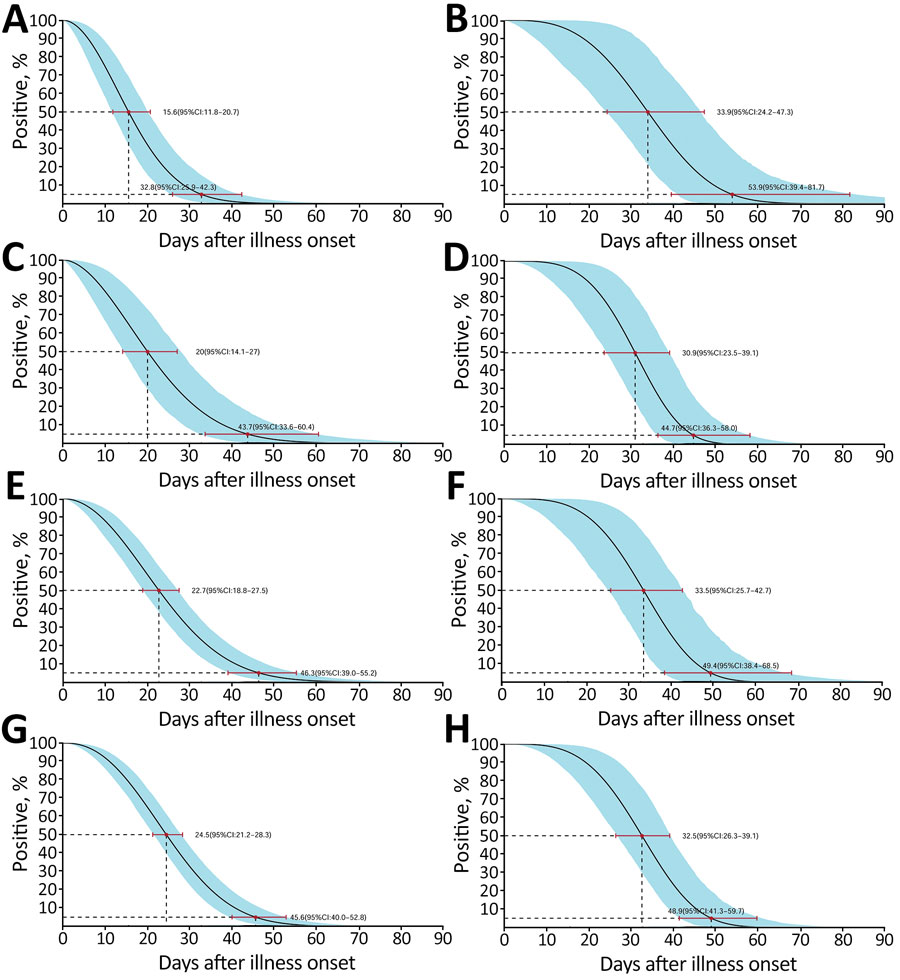
Figure 1. Time until clearance of severe acute respiratory syndrome coronavirus 2 RNA in throat swab, sputum, nasopharyngeal, and feces samples among hospitalized patients with coronavirus disease, as estimated with the use of Weibull regression, Guangdong, China. A, B) Throat swab specimens from patients with mild (A) and severe (B) cases; C, D) sputum samples from patients with mild (C) and severe (D) cases; nasopharyngeal swab samples from patients with mild (E) and severe (F) cases; G, H) feces samples from patients with mild (G) and severe (H) cases. A total of 43 patients with mild and 6 with severe cases were tested. The medians and 95th percentiles of the time until the loss of detection are indicated; error bars and shading indicate 95% CIs.
Main Article
Page created: May 08, 2020
Page updated: July 19, 2020
Page reviewed: July 19, 2020
The conclusions, findings, and opinions expressed by authors contributing to this journal do not necessarily reflect the official position of the U.S. Department of Health and Human Services, the Public Health Service, the Centers for Disease Control and Prevention, or the authors' affiliated institutions. Use of trade names is for identification only and does not imply endorsement by any of the groups named above.